IoV
A Big Data Fleet Management Tool
Data Visualization, Data Analysis
Client: P2P Car Rental, Commercial vehicle manufacture
ABOUT
IoV (Internet of Vehicle Fleet Management platform) is a product I worked on for Cennavi. It provides a Data Analysis solution for business and government such as logistic company, insurance company and department of transportation that need to manage cars scientifically and accurately with real-time and historical location data. This product has been applied to several projects including car renter company, Commercial vehicle manufacturer.
My Role
Product Owner Product Design UX Design Research Roadmap Communication
As the product manager of this product, I am responsible for marketing research, roadmap, premarketing material, product design. There are also a UI designer, data scientist, and engineers on the team led to a very open and collaborative process.
Problem & Marketing Potential
According to data collecting company, since 2016, there are more than 3 billion motor vehicles and 1.4 million trucks in China. The commerical vehicles are over 30000 housand, and there are over 1000 thousand fleet companys in China, many of which are still using the traditional fleet management system.
As the rapid development of the Internet of Vehicles and data industry, scientific management methods are needed to decrease the cost caused by information lag to improve the economic benefits.
Solution
Internet of Vehicle Data Analysis platform is designed to improve fleet management by using big data analysis. Through the calculation and analysis of the vehicle location macro data and single vehicle location data, the product provides a scientific data basis for the managers to control the real-time distribution of vehicle assets, understand the operation of vehicles, and make regulatory decisions quickly.
Data Source
- Basic data requirement to clients: GPS data from vehicles, or drivers' mobile phones.
- Add on data source: Any data can be collected from vehicles, such as data from T-Box, car sensors. More analysis can be customized if more data can be added.
- Geographical Data: Cennavi provides geographical data.
Scenario
Features
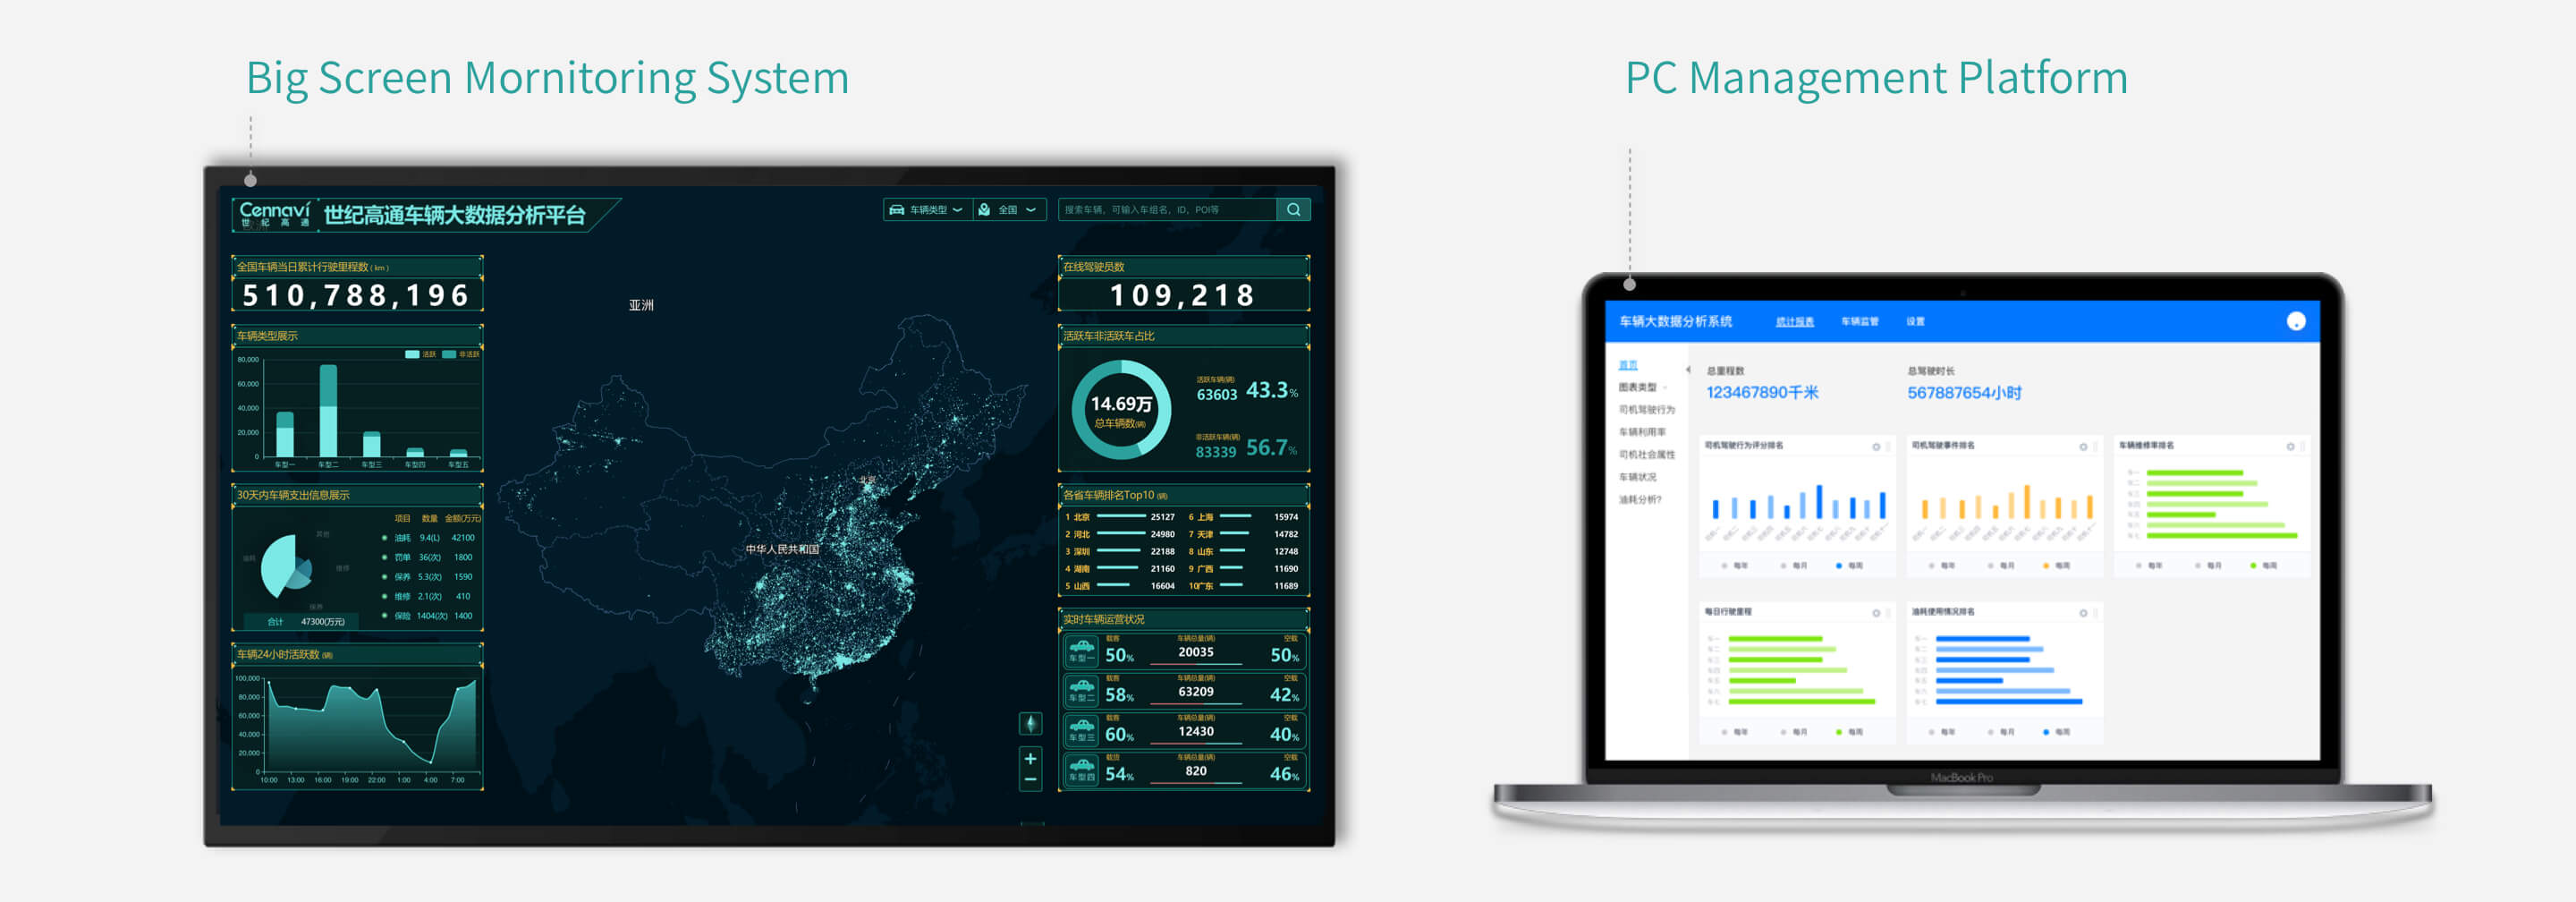
First Milestone - Big Screen Monitoring System
Version one for the 1st launch is focused on the most fundamental functions as below. The key idea of these three functions is to help business understand their data easily by visualization it on the map.
1.Real-time distribution of vehicles
Visualize Distribution of Vehicles with related data analysis.
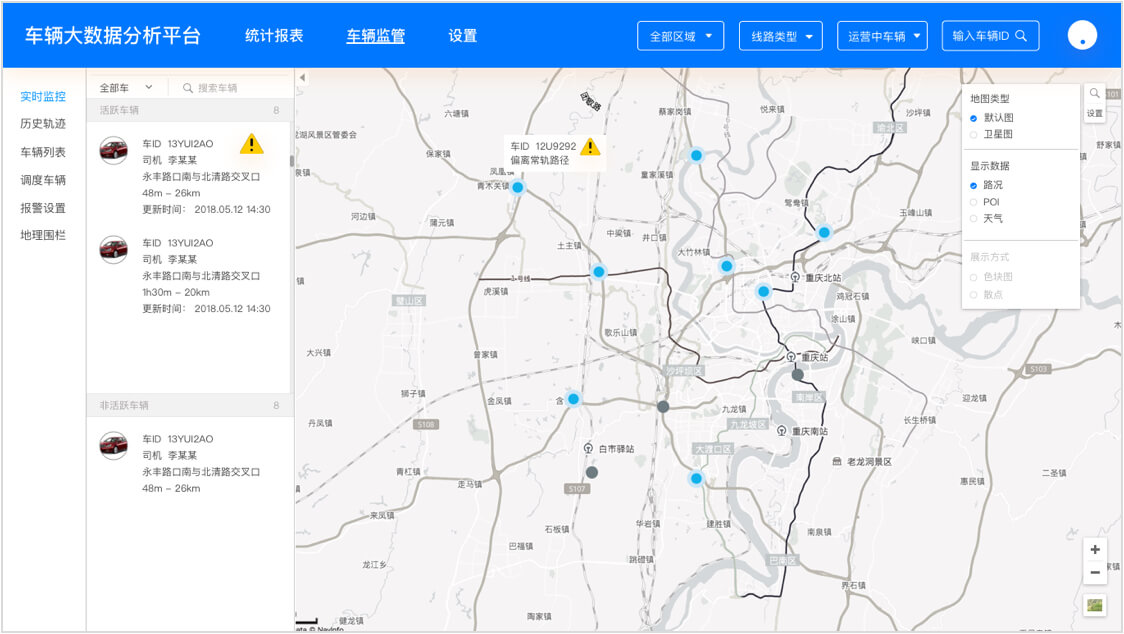
2.Tracking a vehicle's real-time location
Track and monitor real-time vehicle status. The visual monitoring of the real-time location and status of vehicles on a map can help managers understand the current operation status of each vehicle in time.
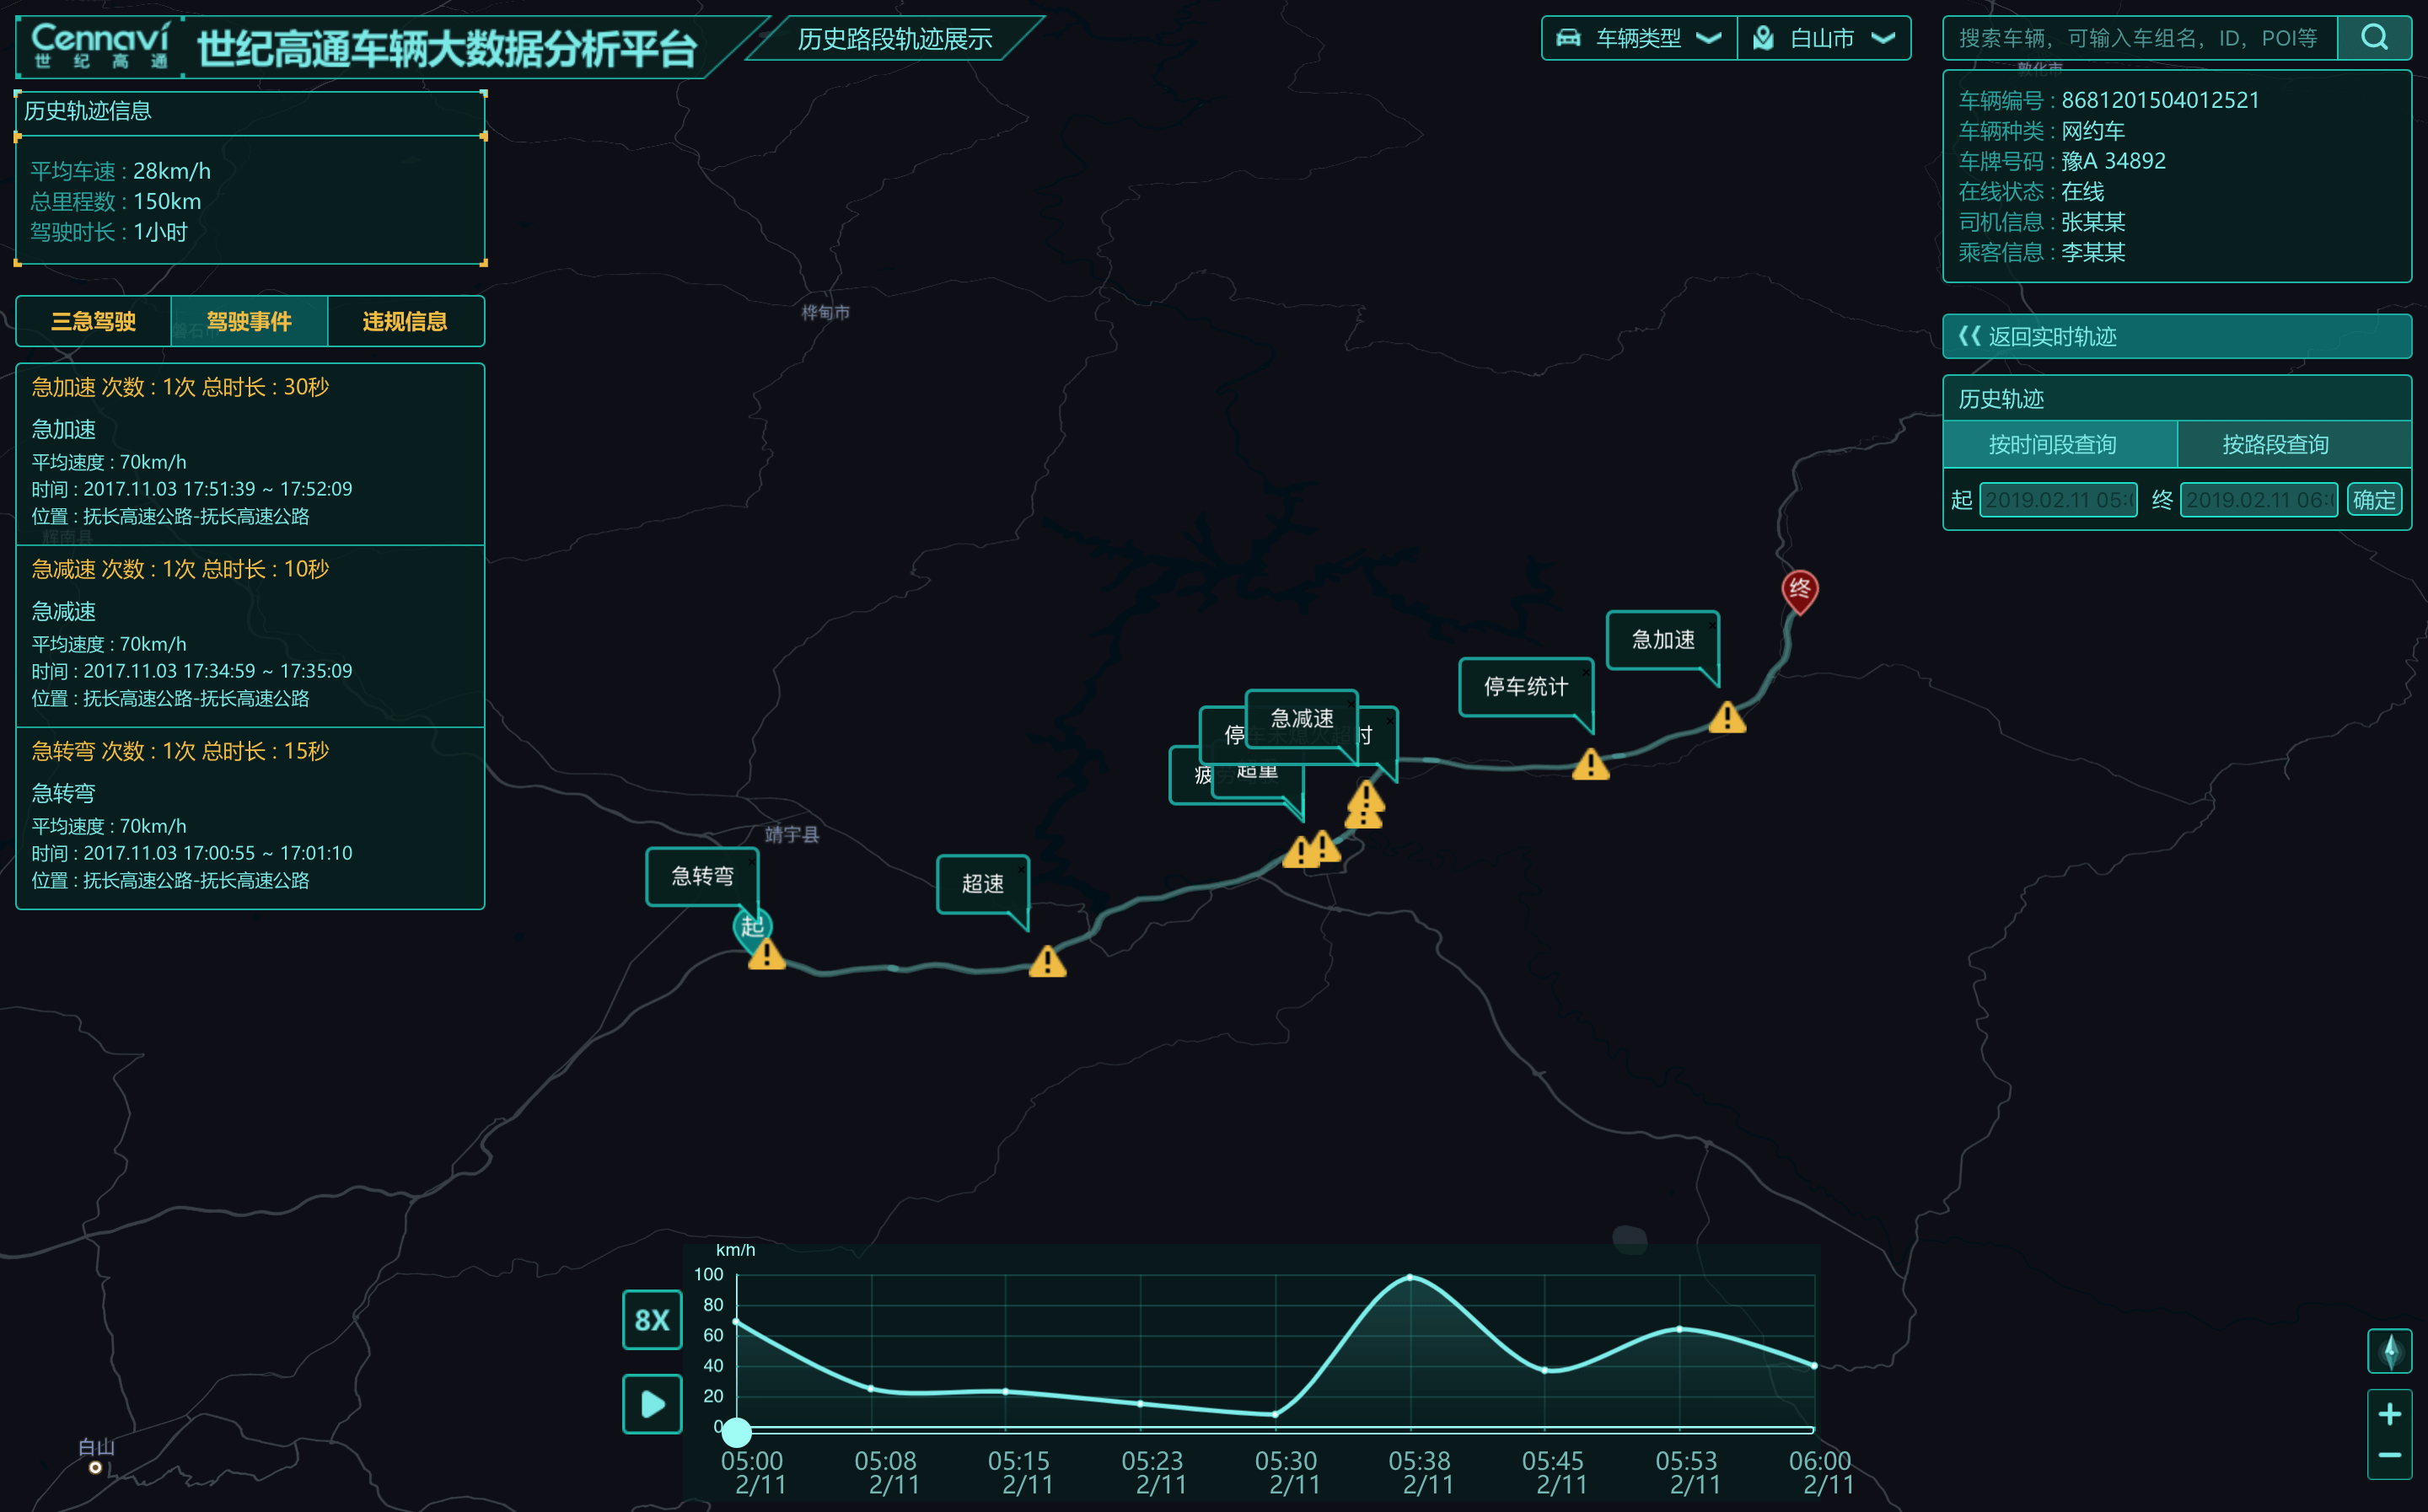
3.Analyze vehicle's historical trajectory
Analyze vehicle’s historical trajectory to understand the driver’s behavior and provide evidence of the abnormal situation.
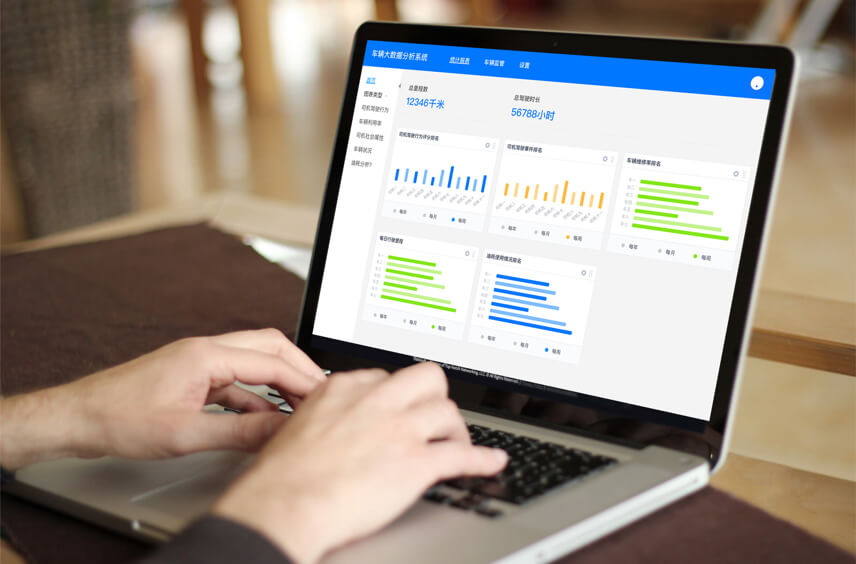
Second Milestone - PC Management Dashboard
The second milestone of this product is to go deeper into the business insights; provide more management supportive tools using data analysis. Except for the three fundamental functions from the monitoring version, new features on the PC version management dashboard are as below:
1.Utilize historical data to optimize future management
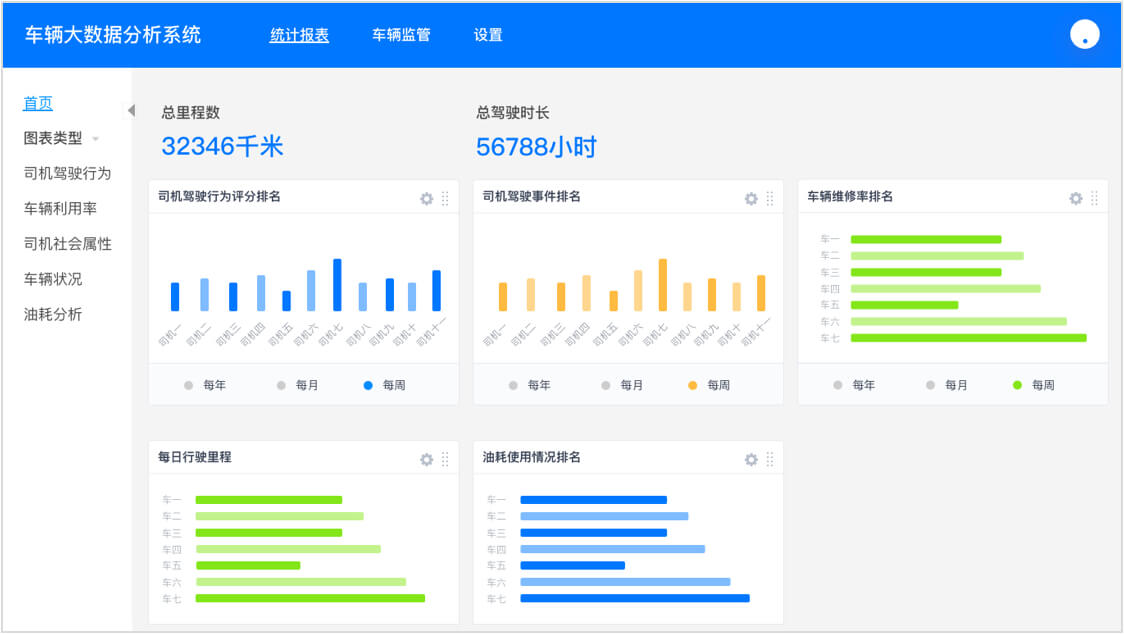
Timely Data Report providing KPI (Key performance indicators) based on historical data to help managers
make smarter decisions. These reports include driver behavior analysis, vehicle utilization, driver profile, energy cost report.
 <
<
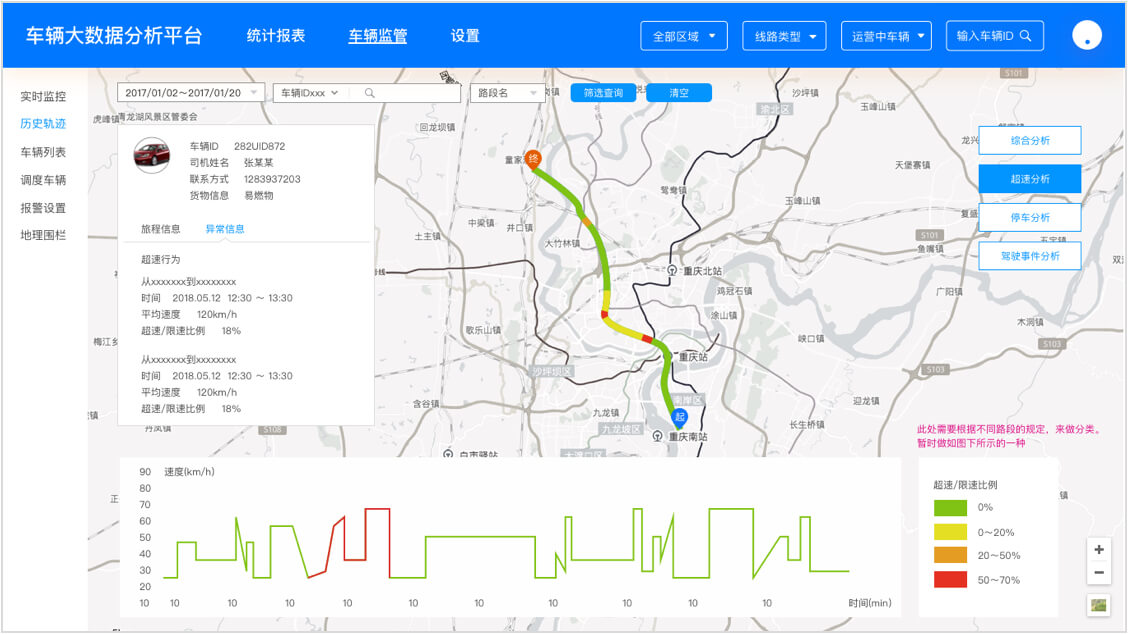
Learn driver behavior through vehicle historical trajectory analysis. Understand the normal driving area,
driving speed, abnormal driving behavior.
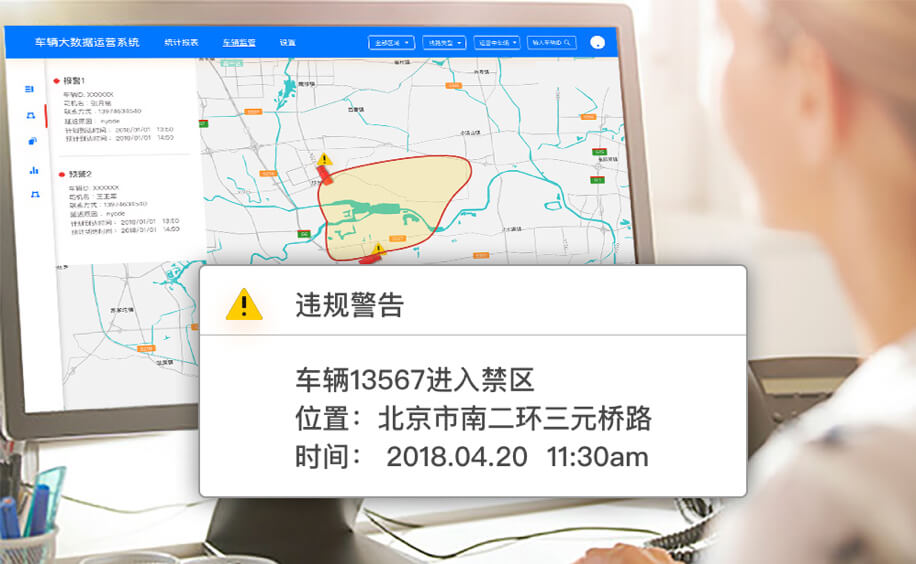
2. Real-time control of the operating index
Mornitoring vehicles in real-time. Get timely notification of abnormal events
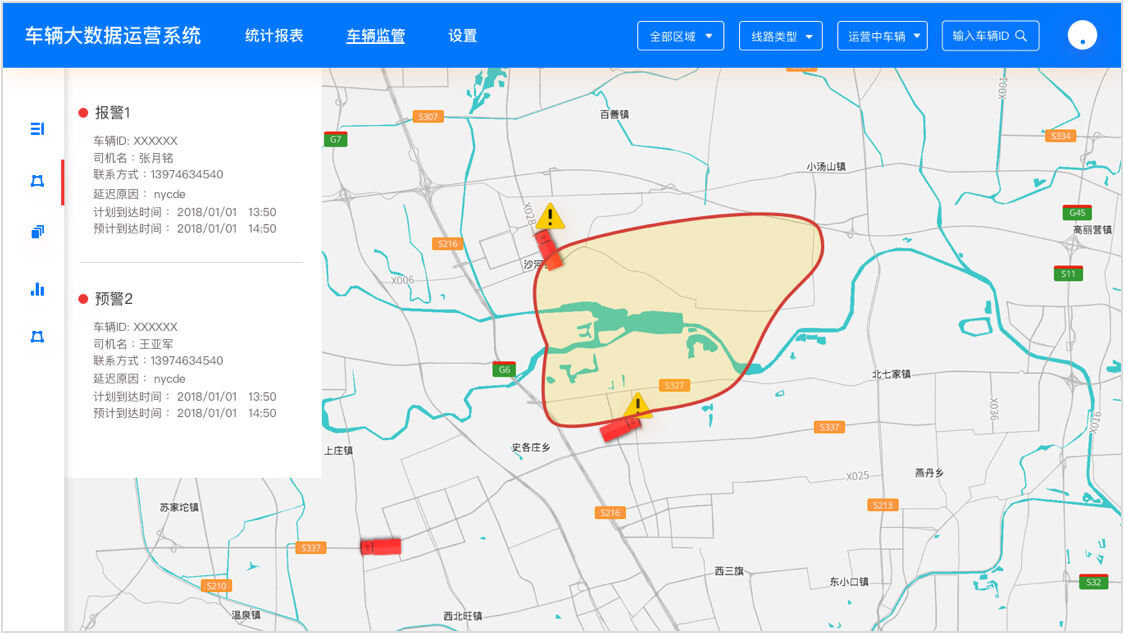
Using geofencing to detect vehicles driving behavior in specific area, and get real-time alert of
abnormal events
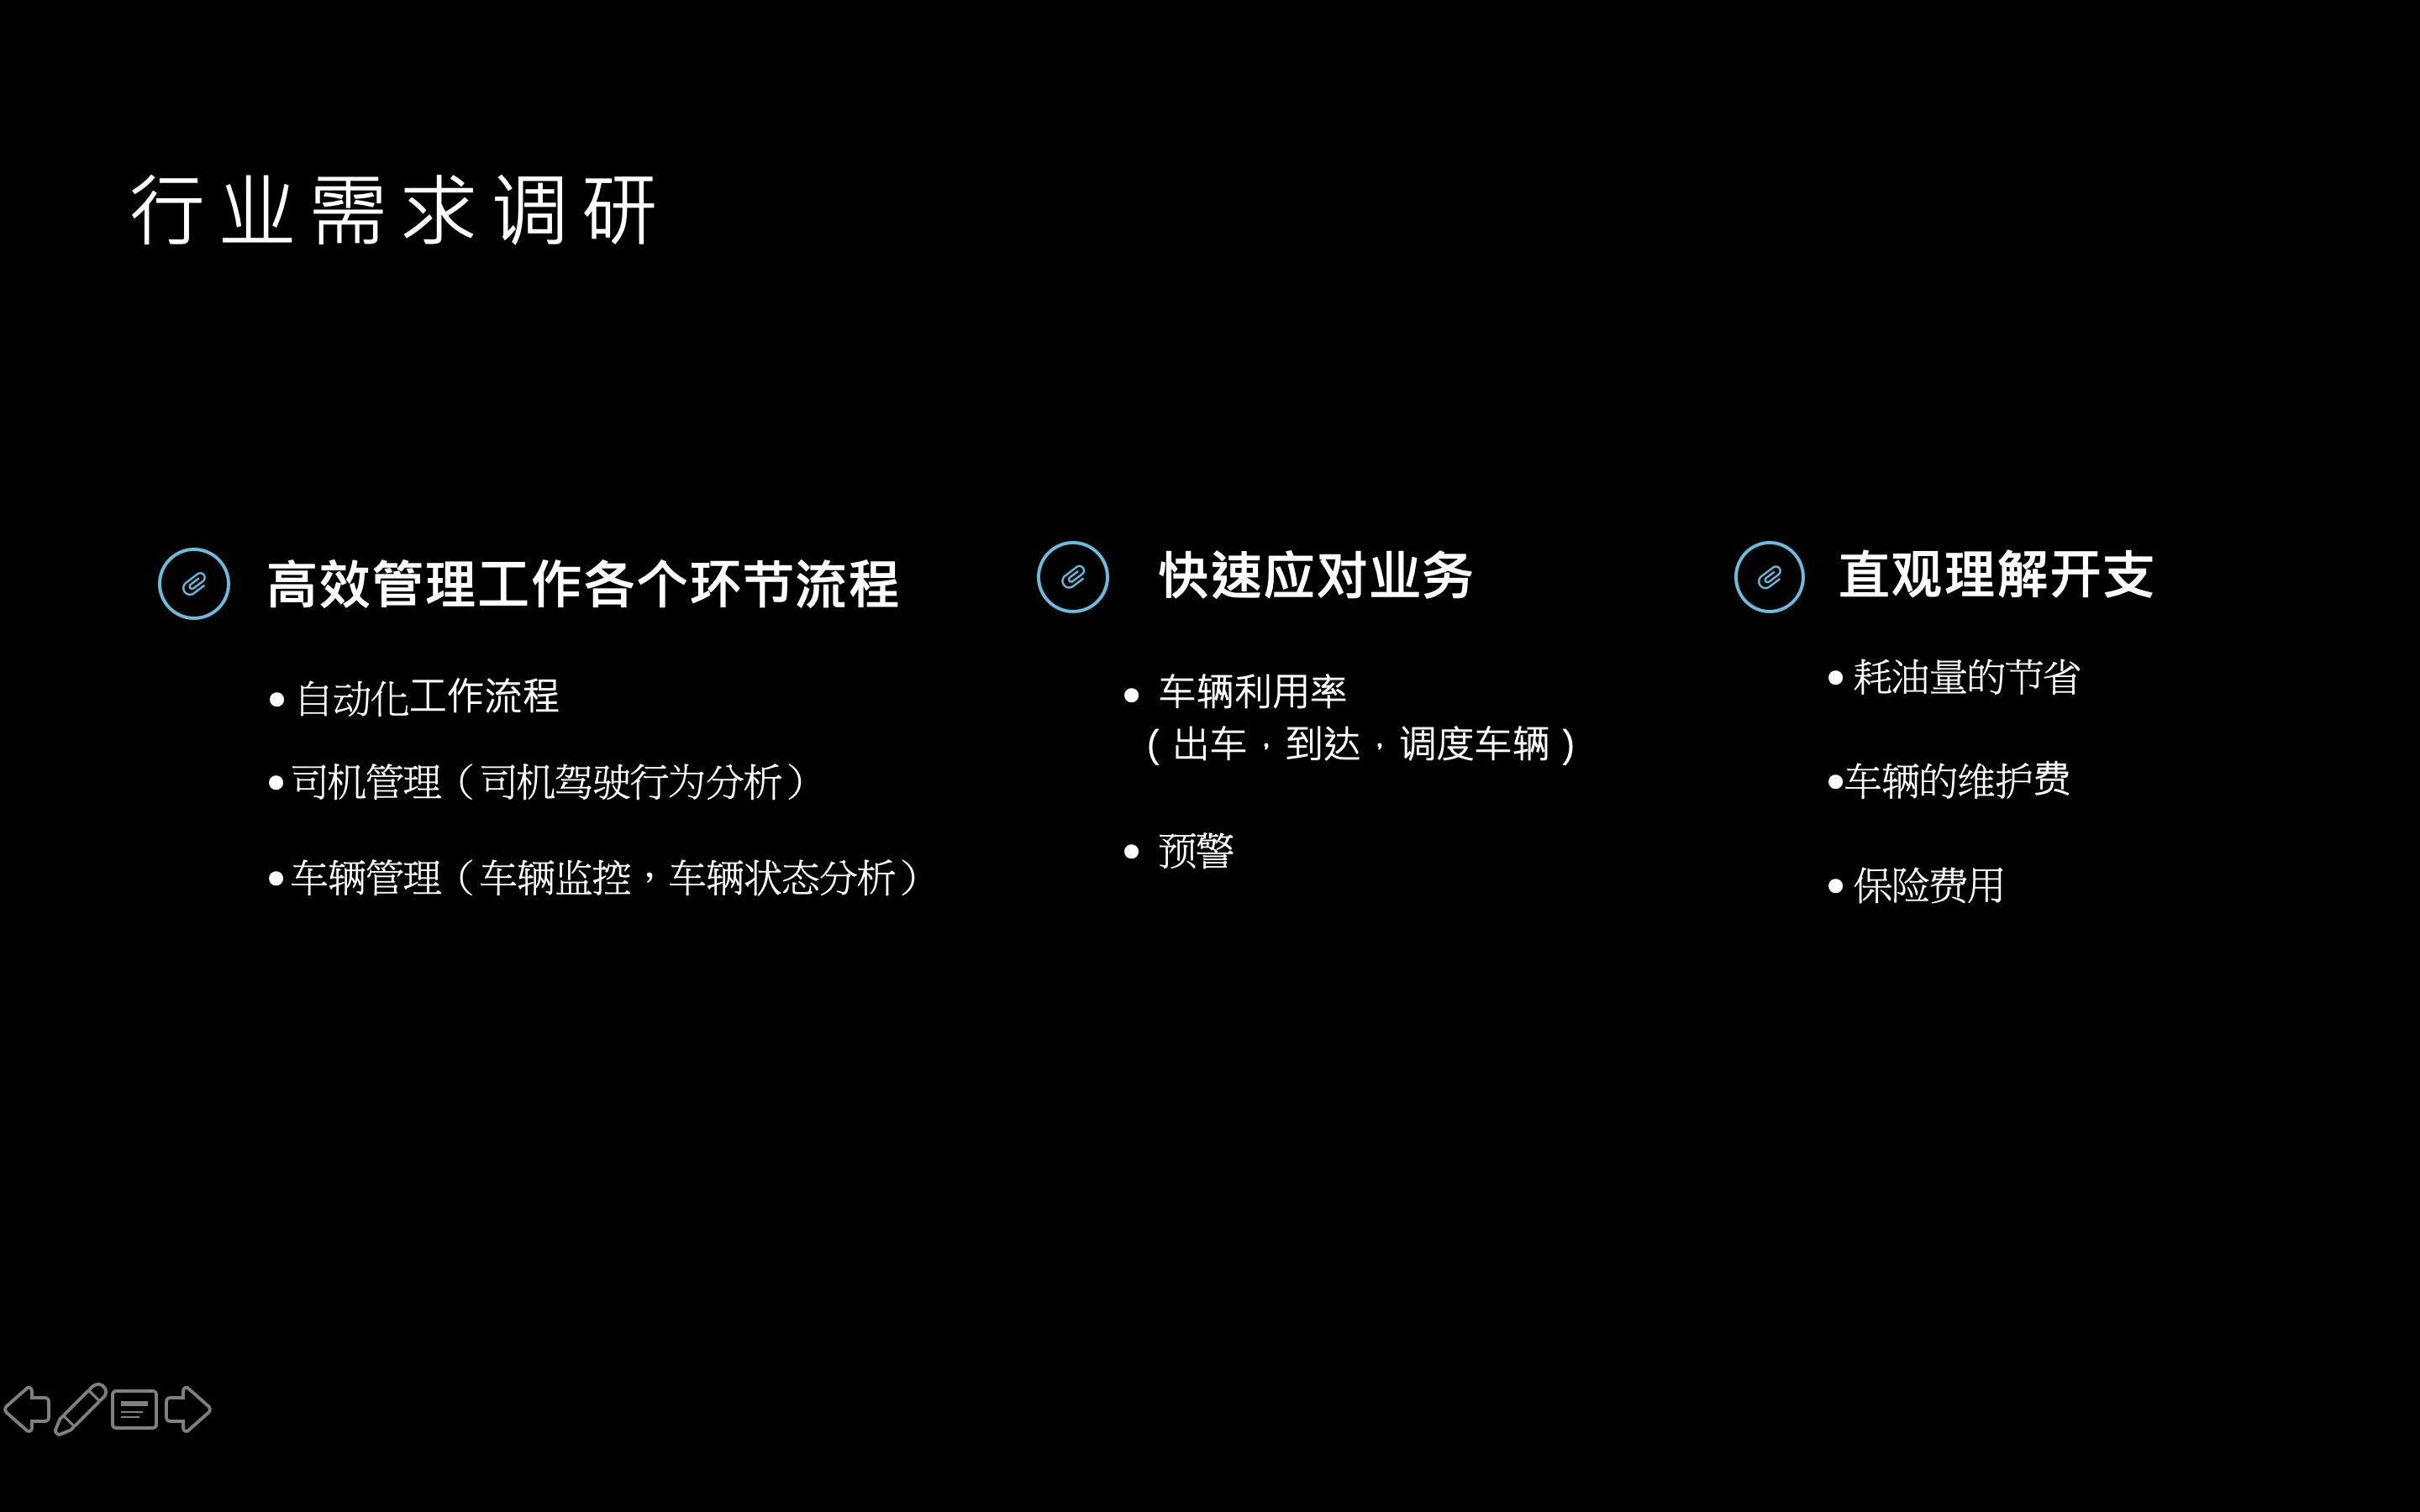
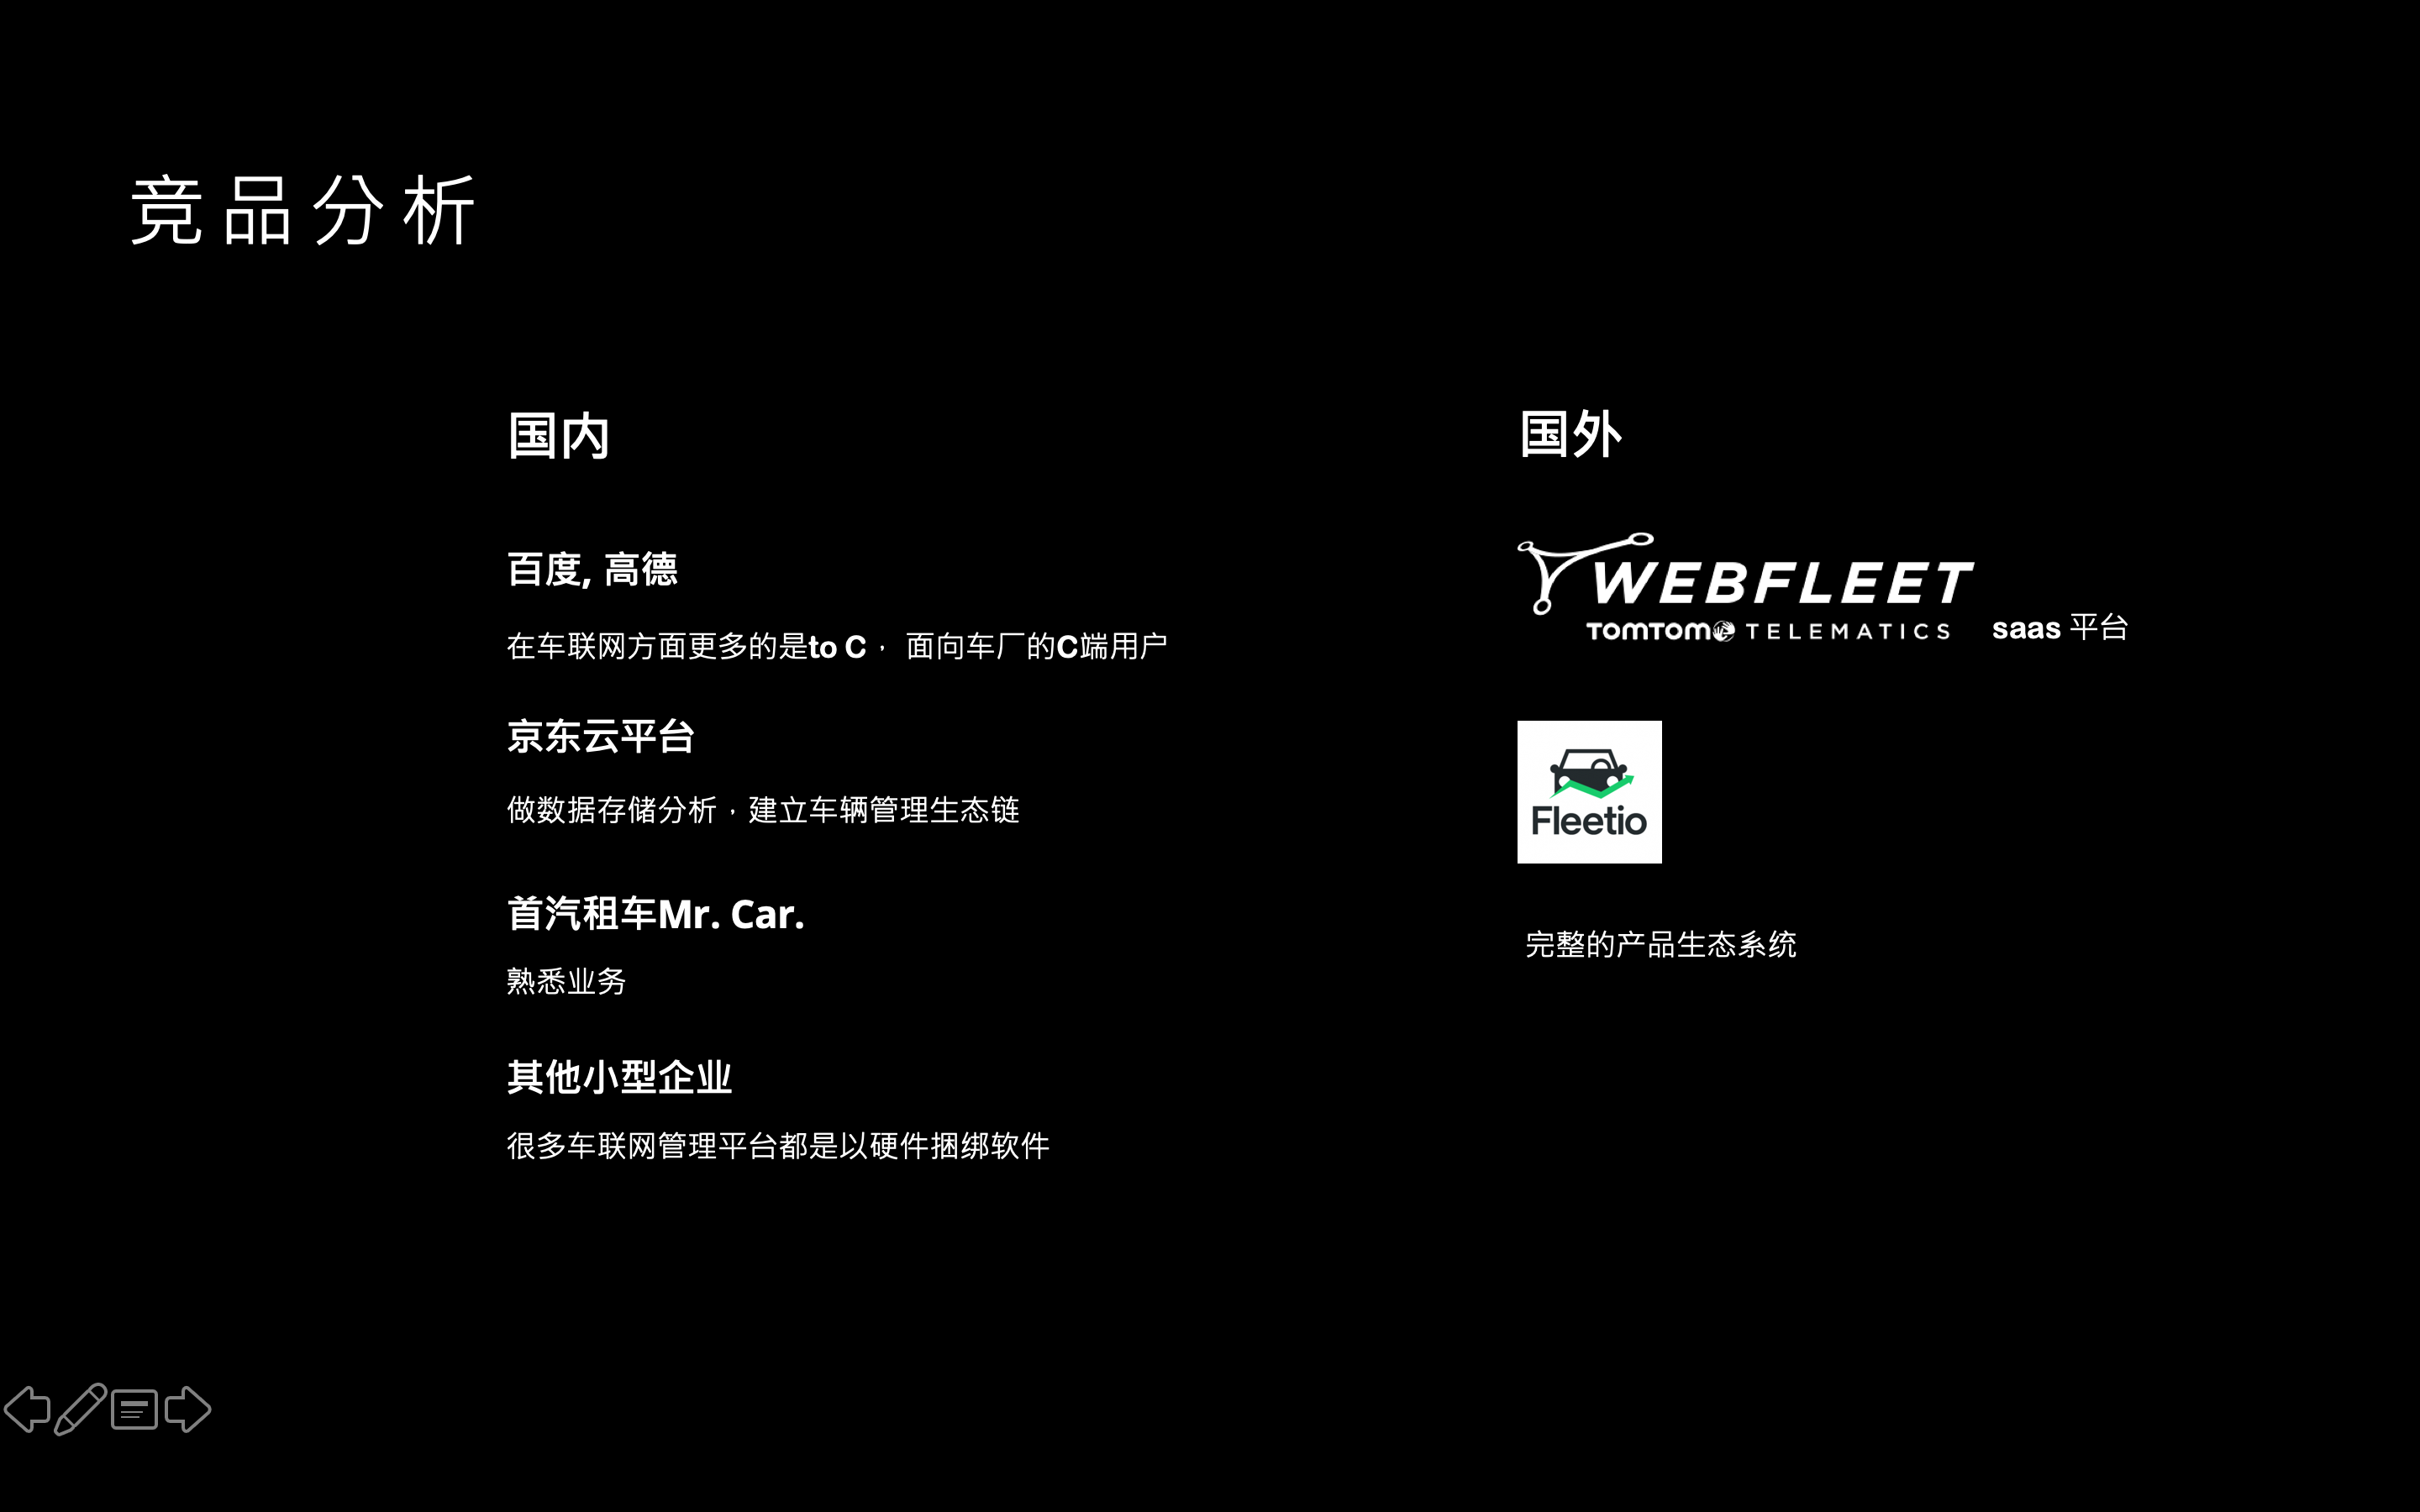
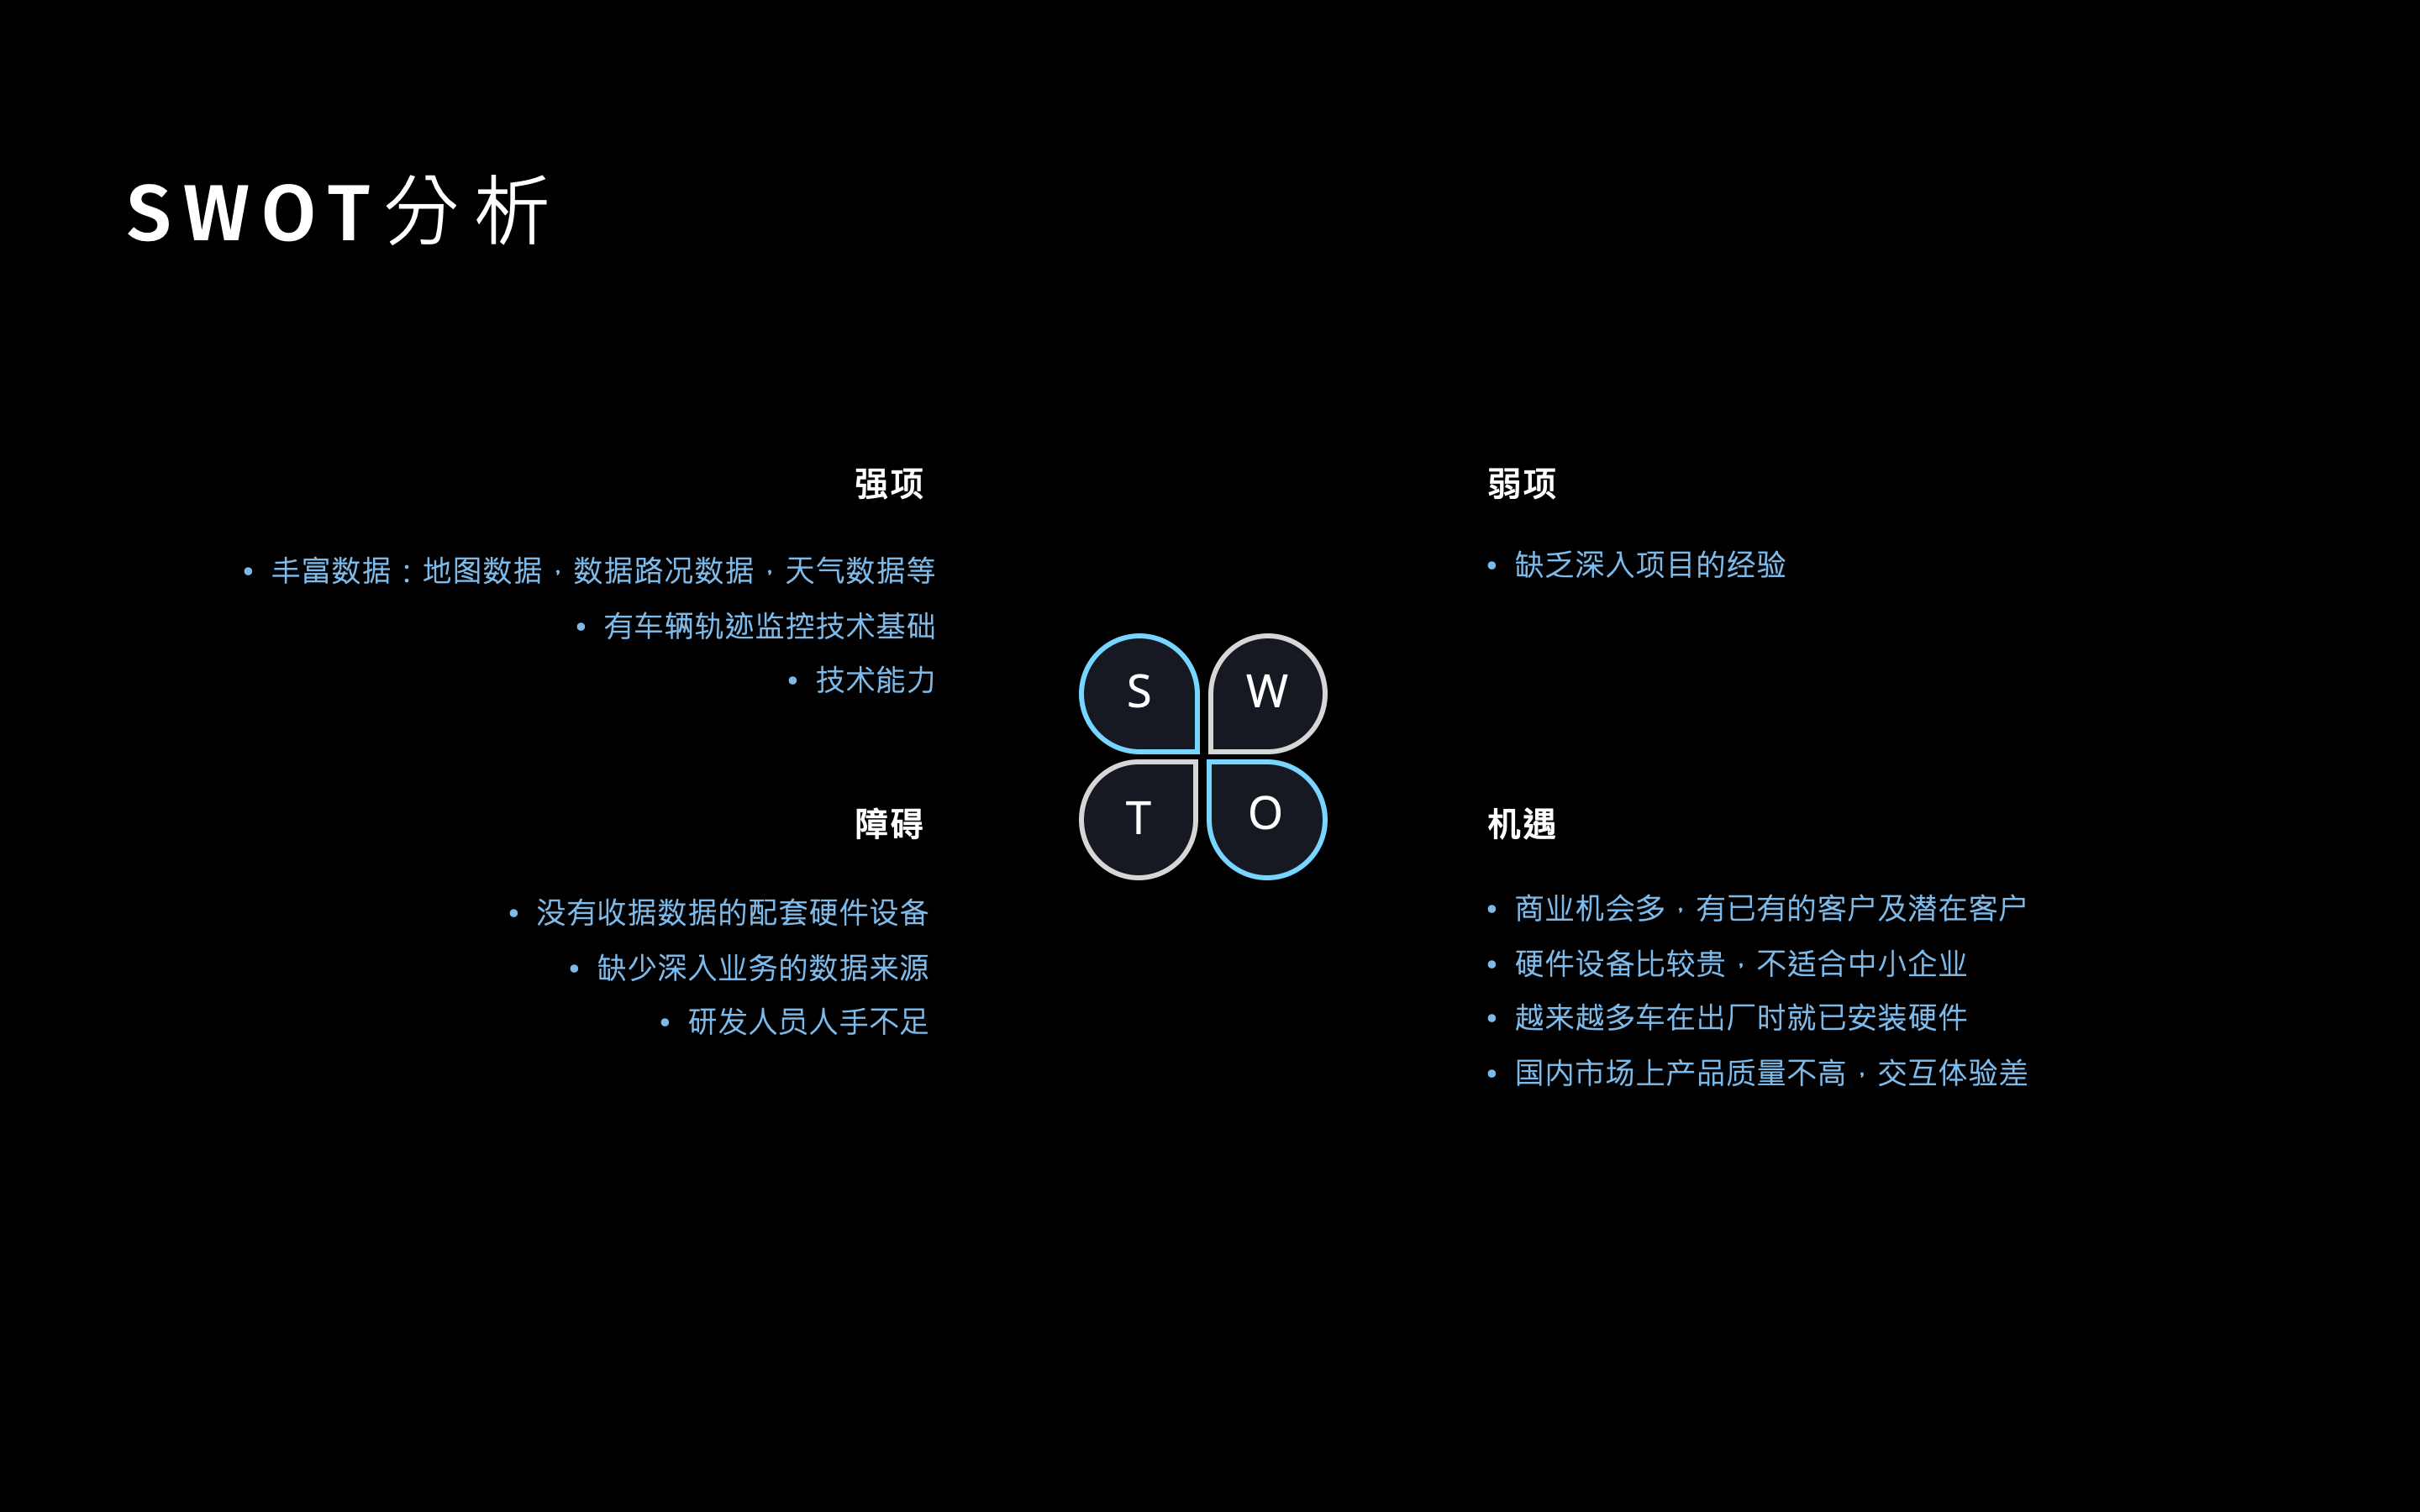
Marketing Research

Design Process
Big Screen Mornitoring System
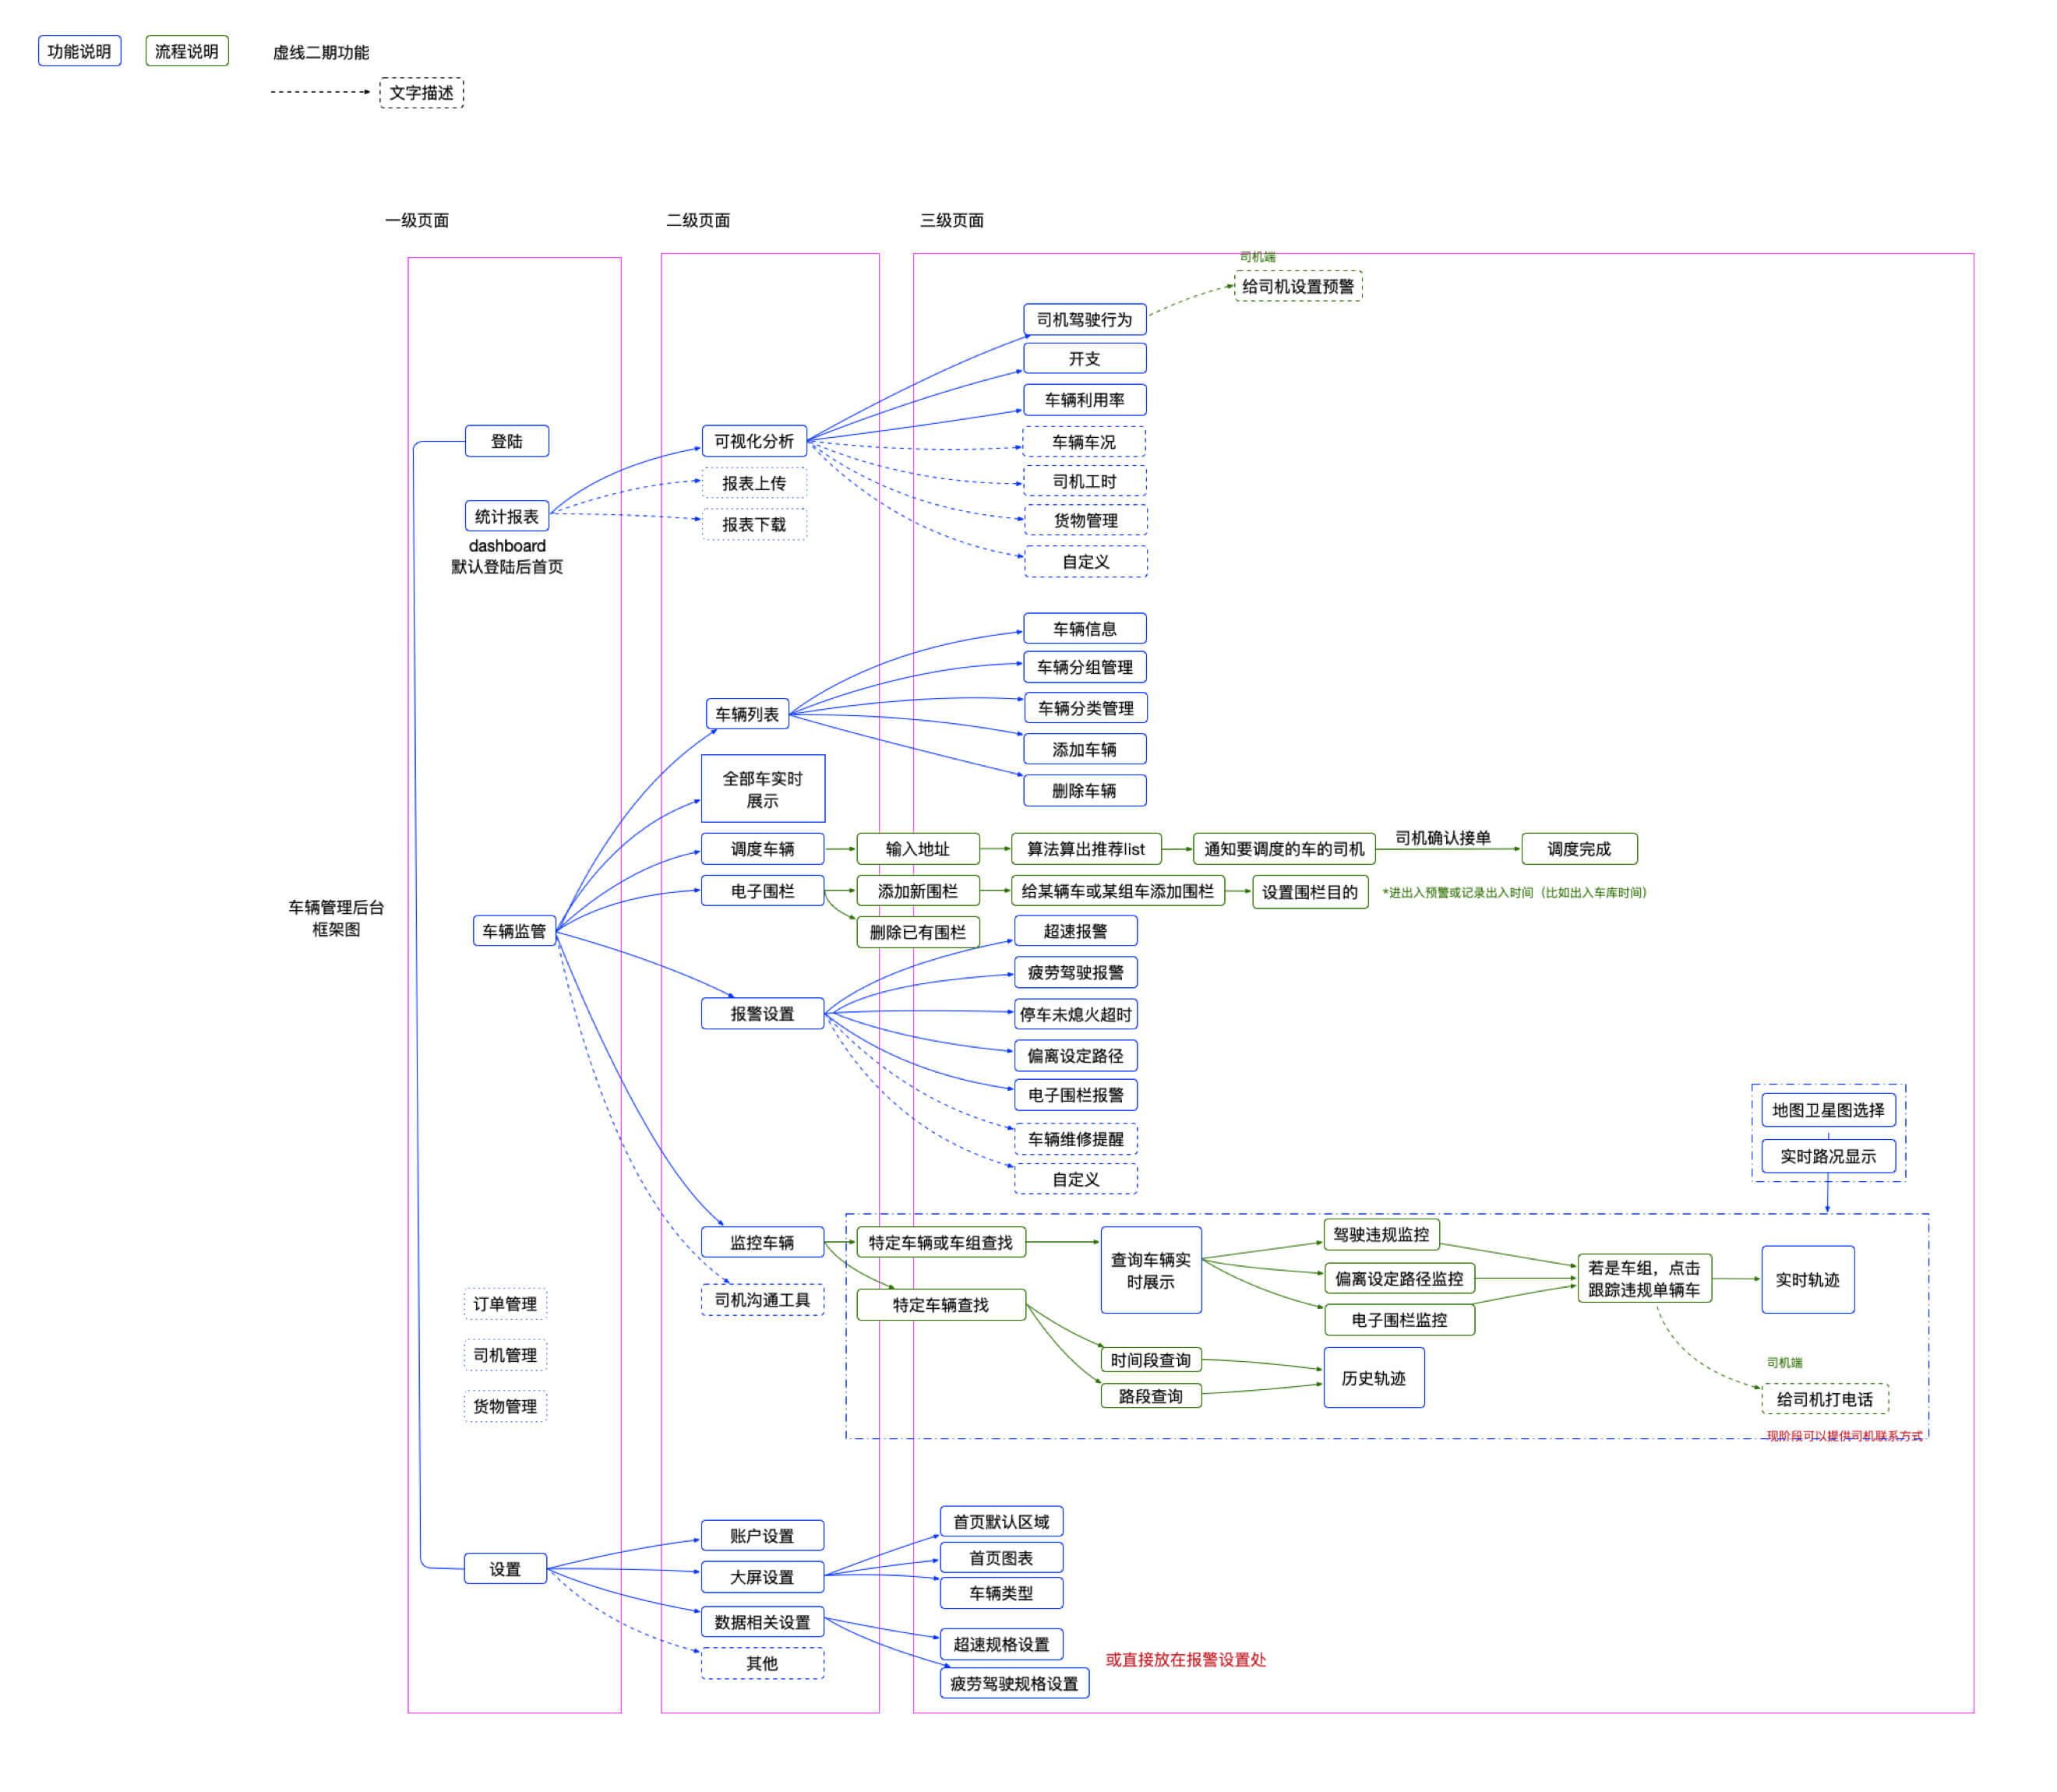
1.Info Architecture
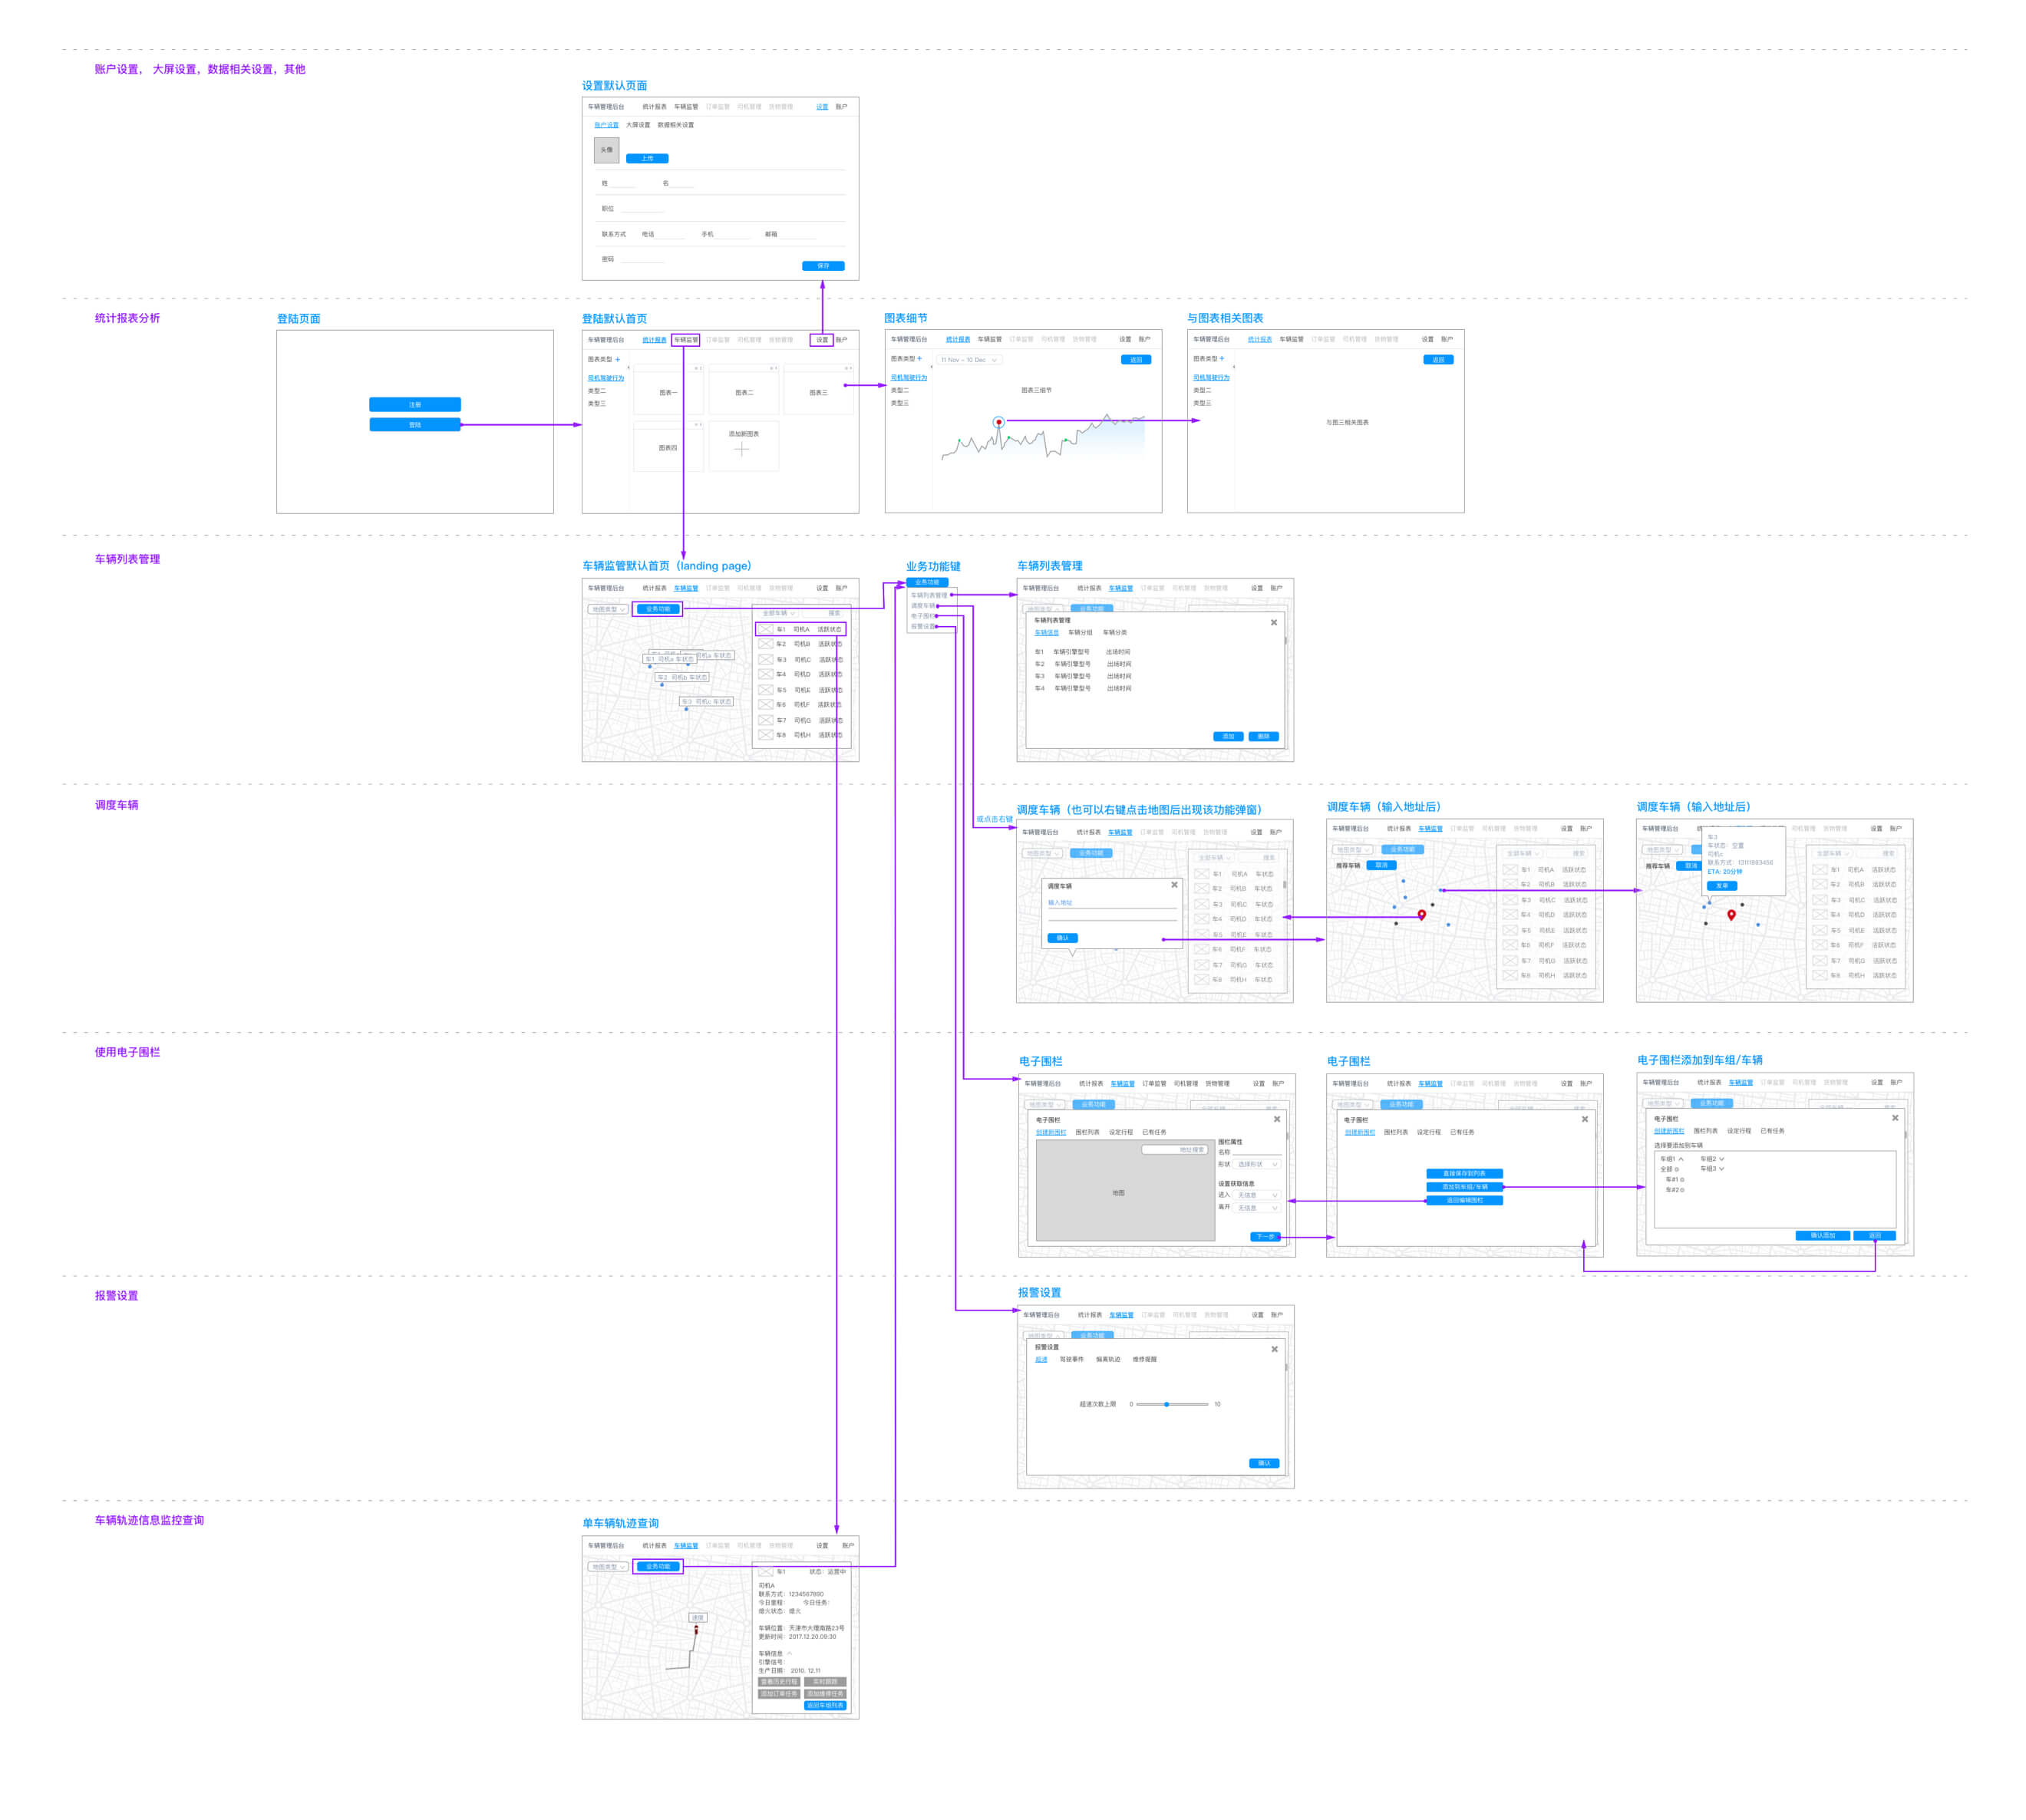
2.User Flow
3.Wireframe
PC Management Dashboard
1.User Journey
2.Info Architecture
3.Wireframe
Key Takeaways
- 1. While planning this product, except understanding the need of the market, on the roadmap I needed to analyze the strength of the company, and plan the essential fundamental features for the first milestone.
- 2. Since it is a data-driven product, the priority of the features on the roadmap not only based on the needs but also based on the accessibility of data resource. Except the data sources Cennavi already have, I also needed to figure out the possibilities of the data sources the clients might be able to provide.