DataHub
Understand marketing,customers,and
service usability better with data
Data Visualization, Data Analysis
Client: Dailmer/Audi
ABOUT
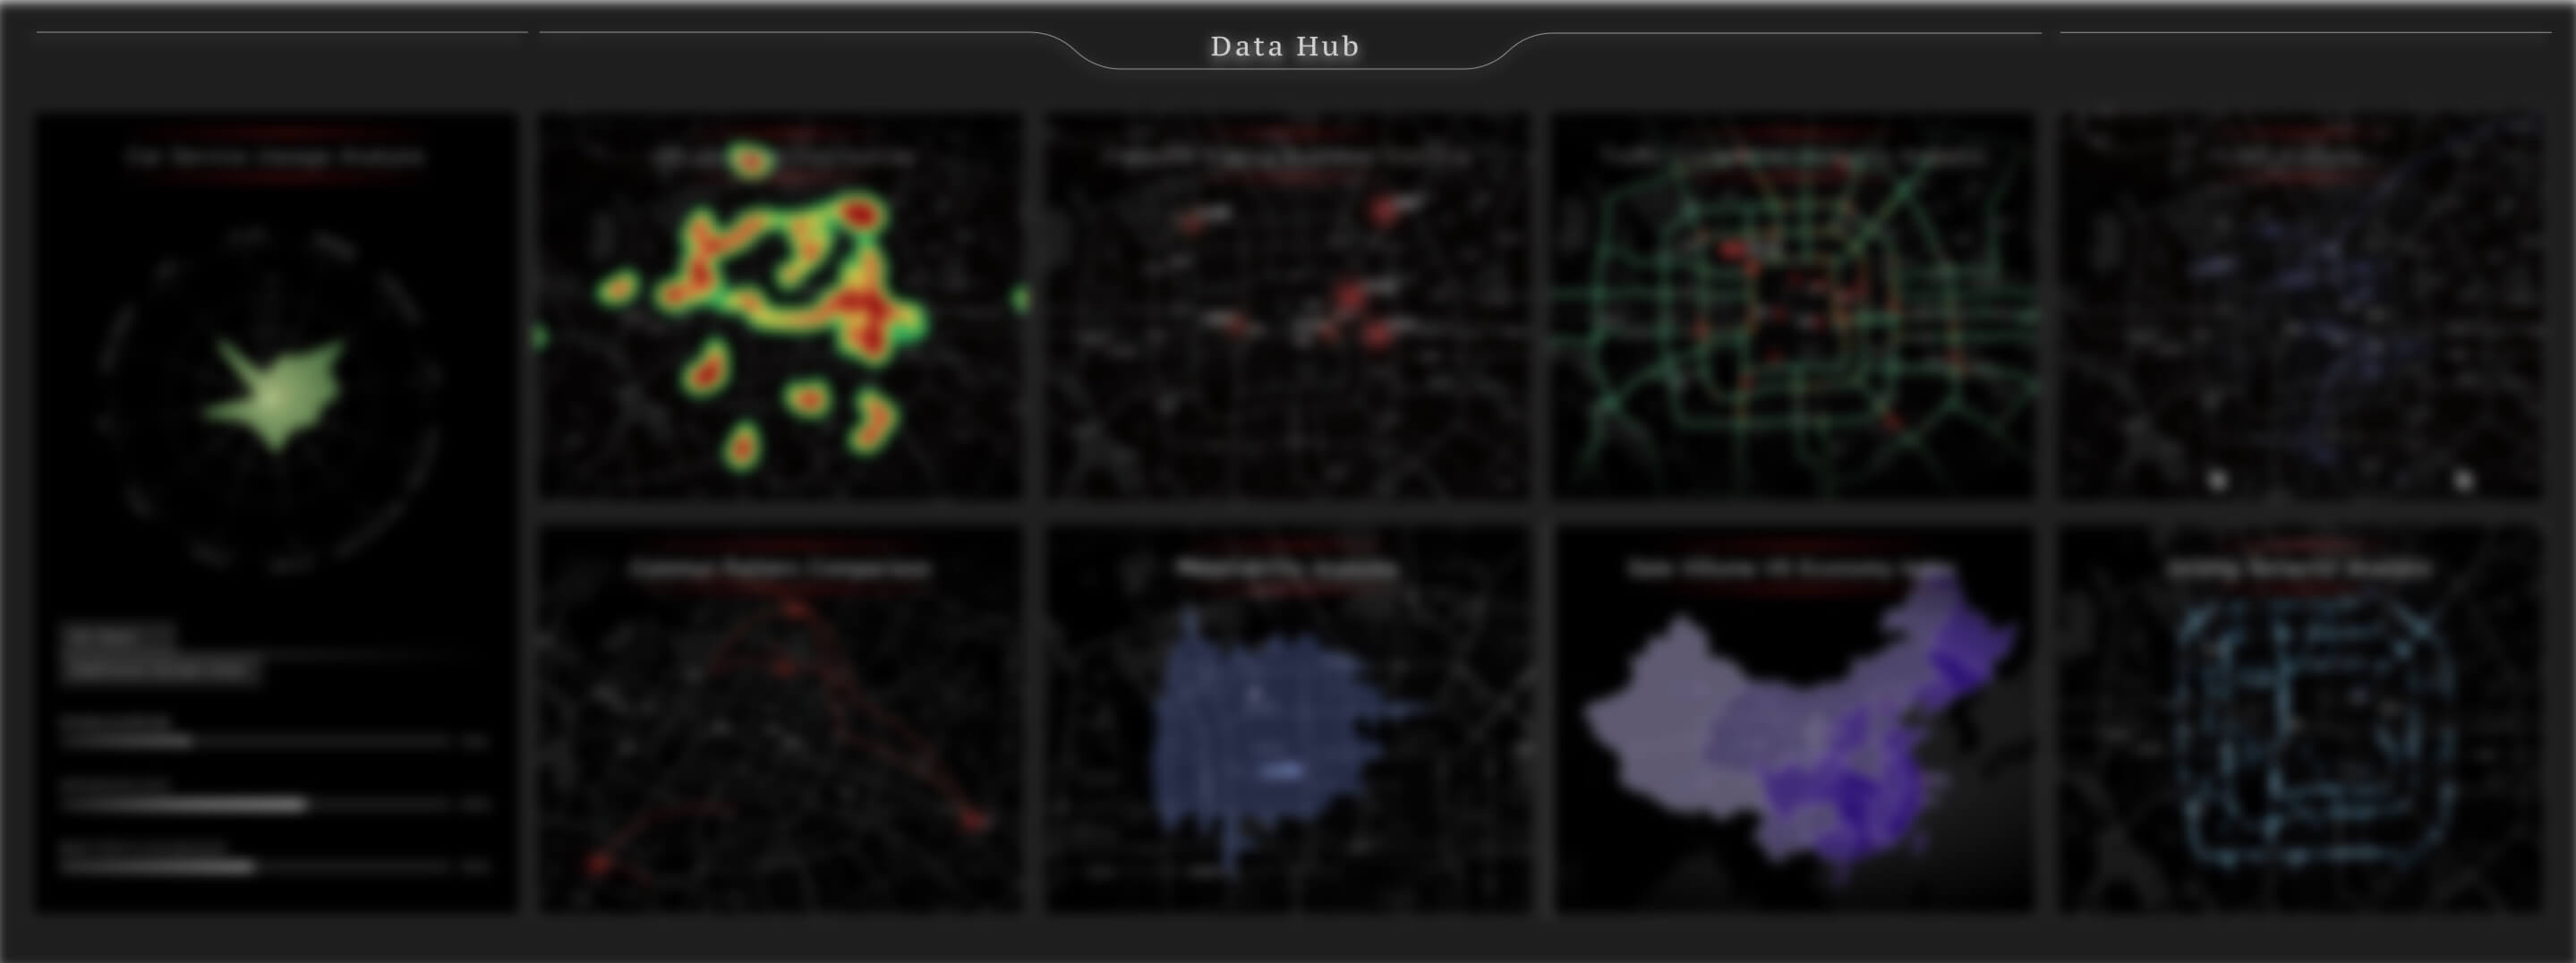
Data Hub is a data analysis and data visualization platform that is designed for automotive manufacturers to mining data values for it's business by combining data collected from car sensors with a geographical information system.
The projects applied by this product gained interest from both Audi China and Daimler's global CEO, and successfully inspired different departments inside these companies to have more inspiration and needs for it's further development.
Due to policy, I won’t be able to share too many details about this project here. If you are interested in it, please contact me.
My Role
Product Design UX Design Research Communication Pitch Ideas to win RFQ
My role in this project is to design use case proposals and pitch ideas for our clients. Deliver finalized plans to the inside UI designer and engineering team. I made use cases based on figuring out potential values the data analysis can bring to the market, and how to visualize the potentials to an informational analyzing platform.
Overview
There are two main analyzing perspectives it provides to help the business: Firstly, it analyzes car owners’ portrait to support the marketing team to make precious strategies.Secondly,it allows the HMI service designers and engineers to understand better of users behavior by analyzing the usage of the HMI service.
Analyze data types from car sensors
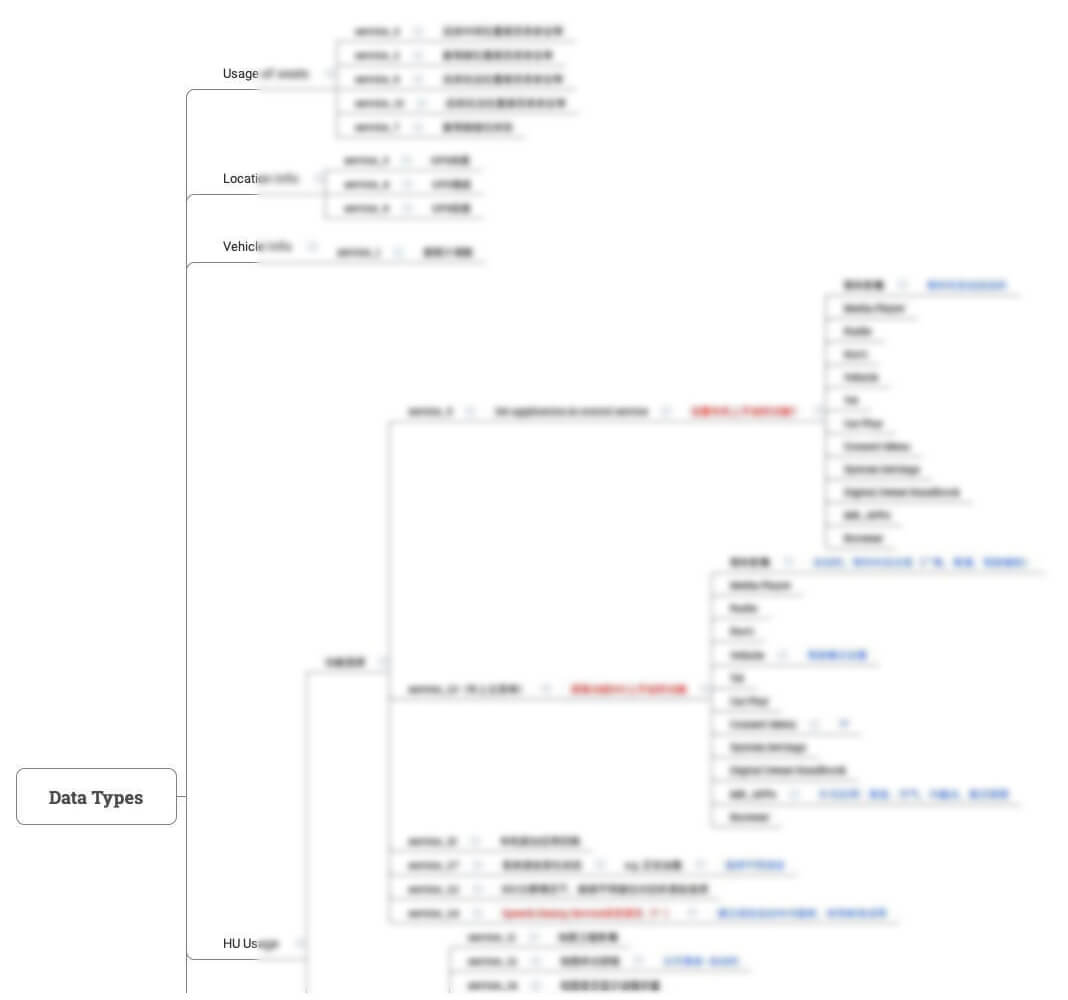
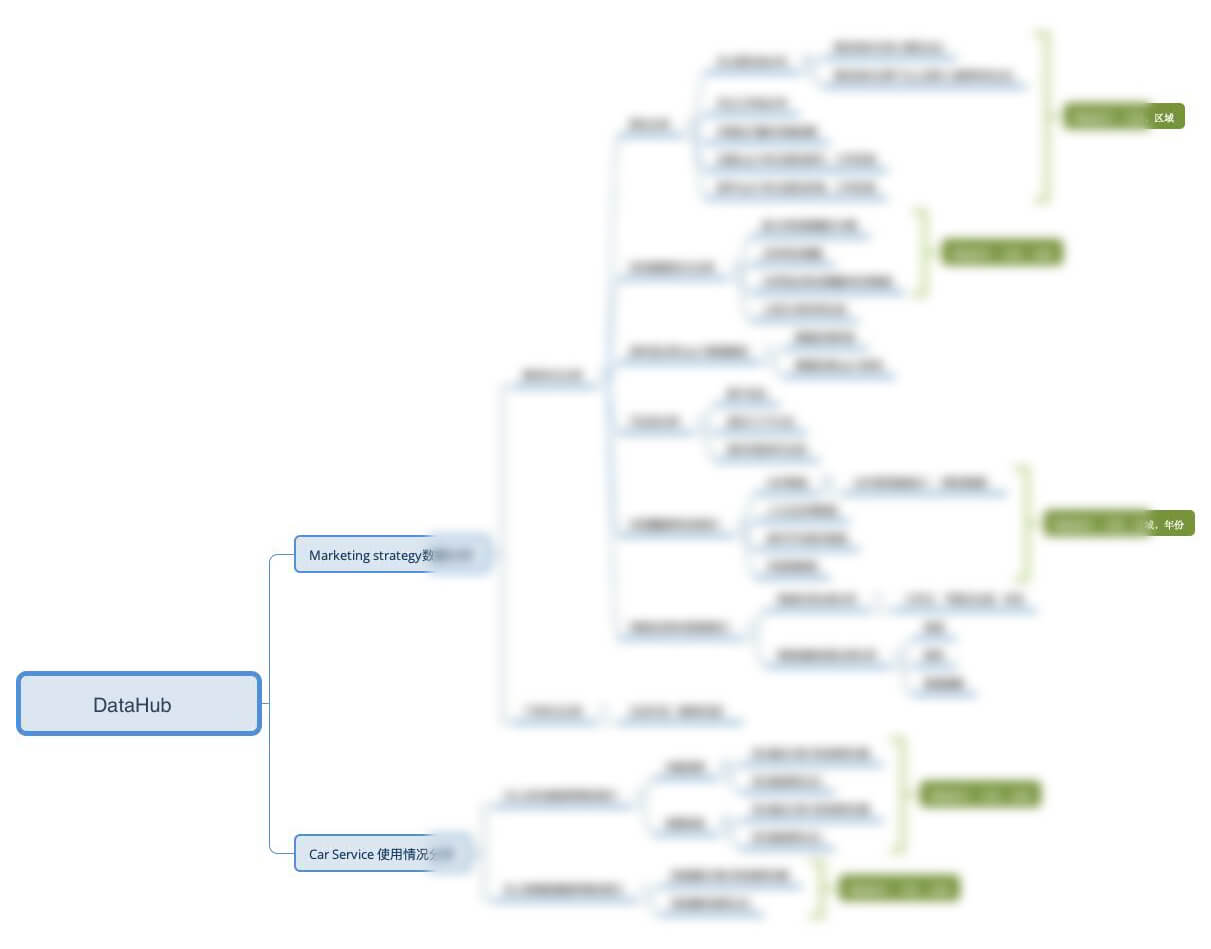
Mindmap of Analysis Usecases
Highlighted Features
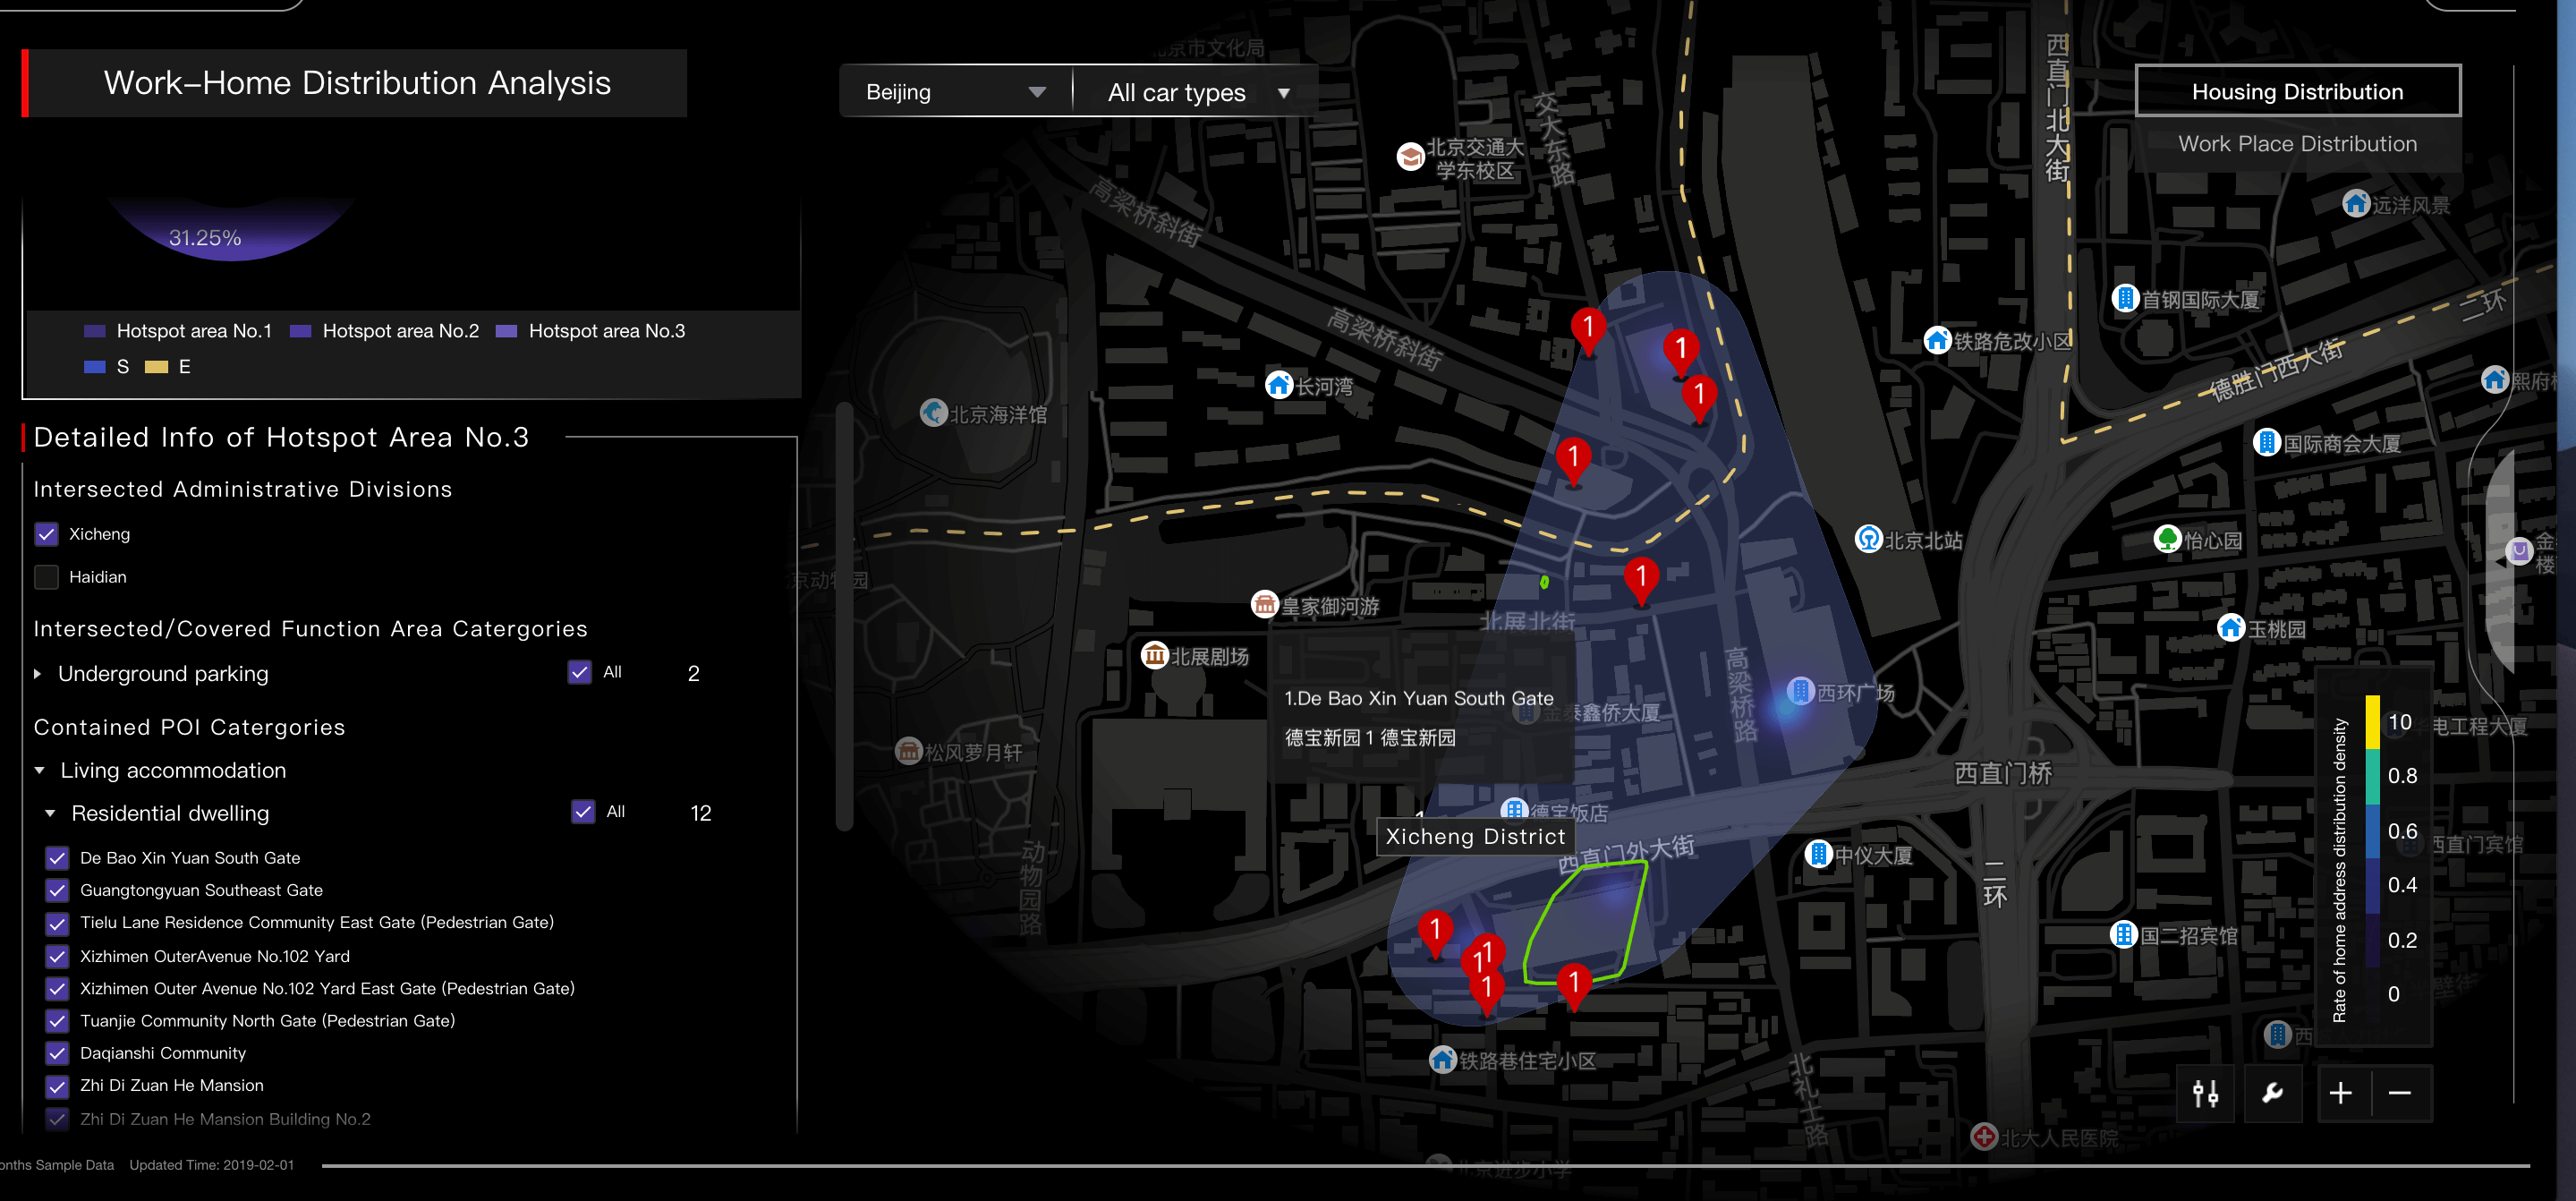
Analyze car owner's job/housing distribution with algorithm by using GPS data
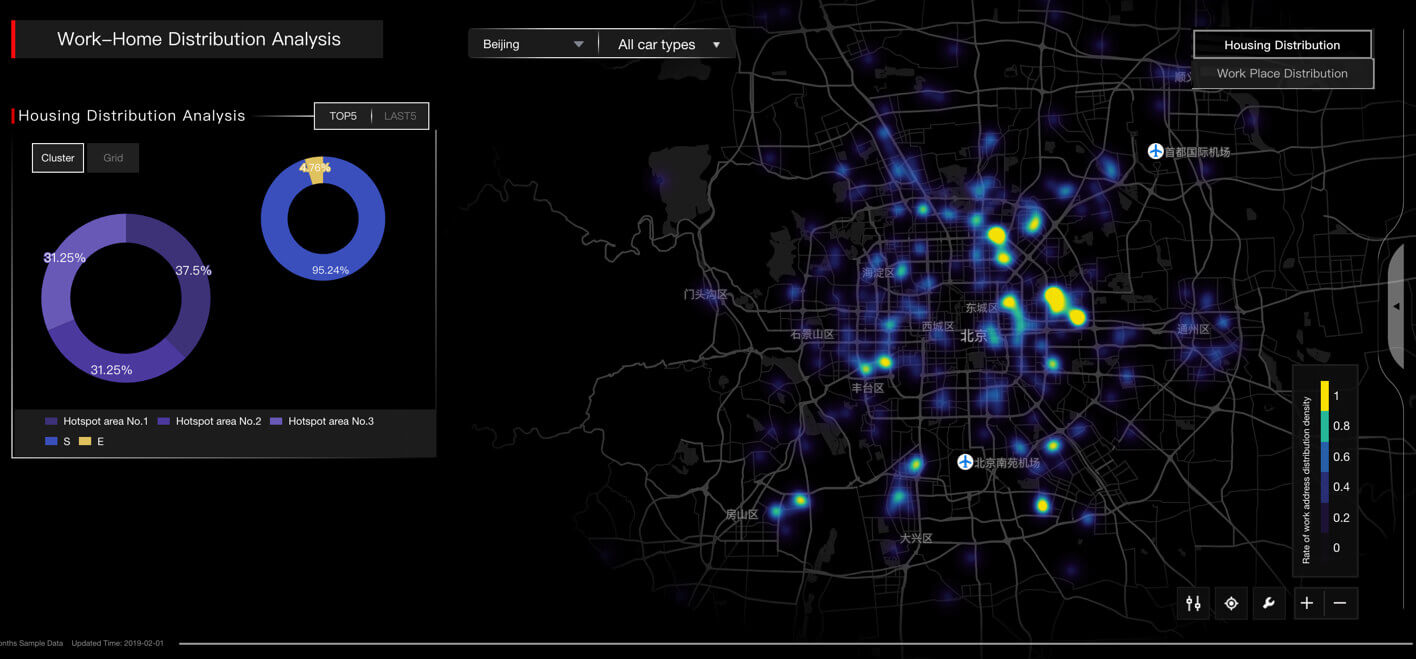
Geographical analysis of selected job/housing Hotspot
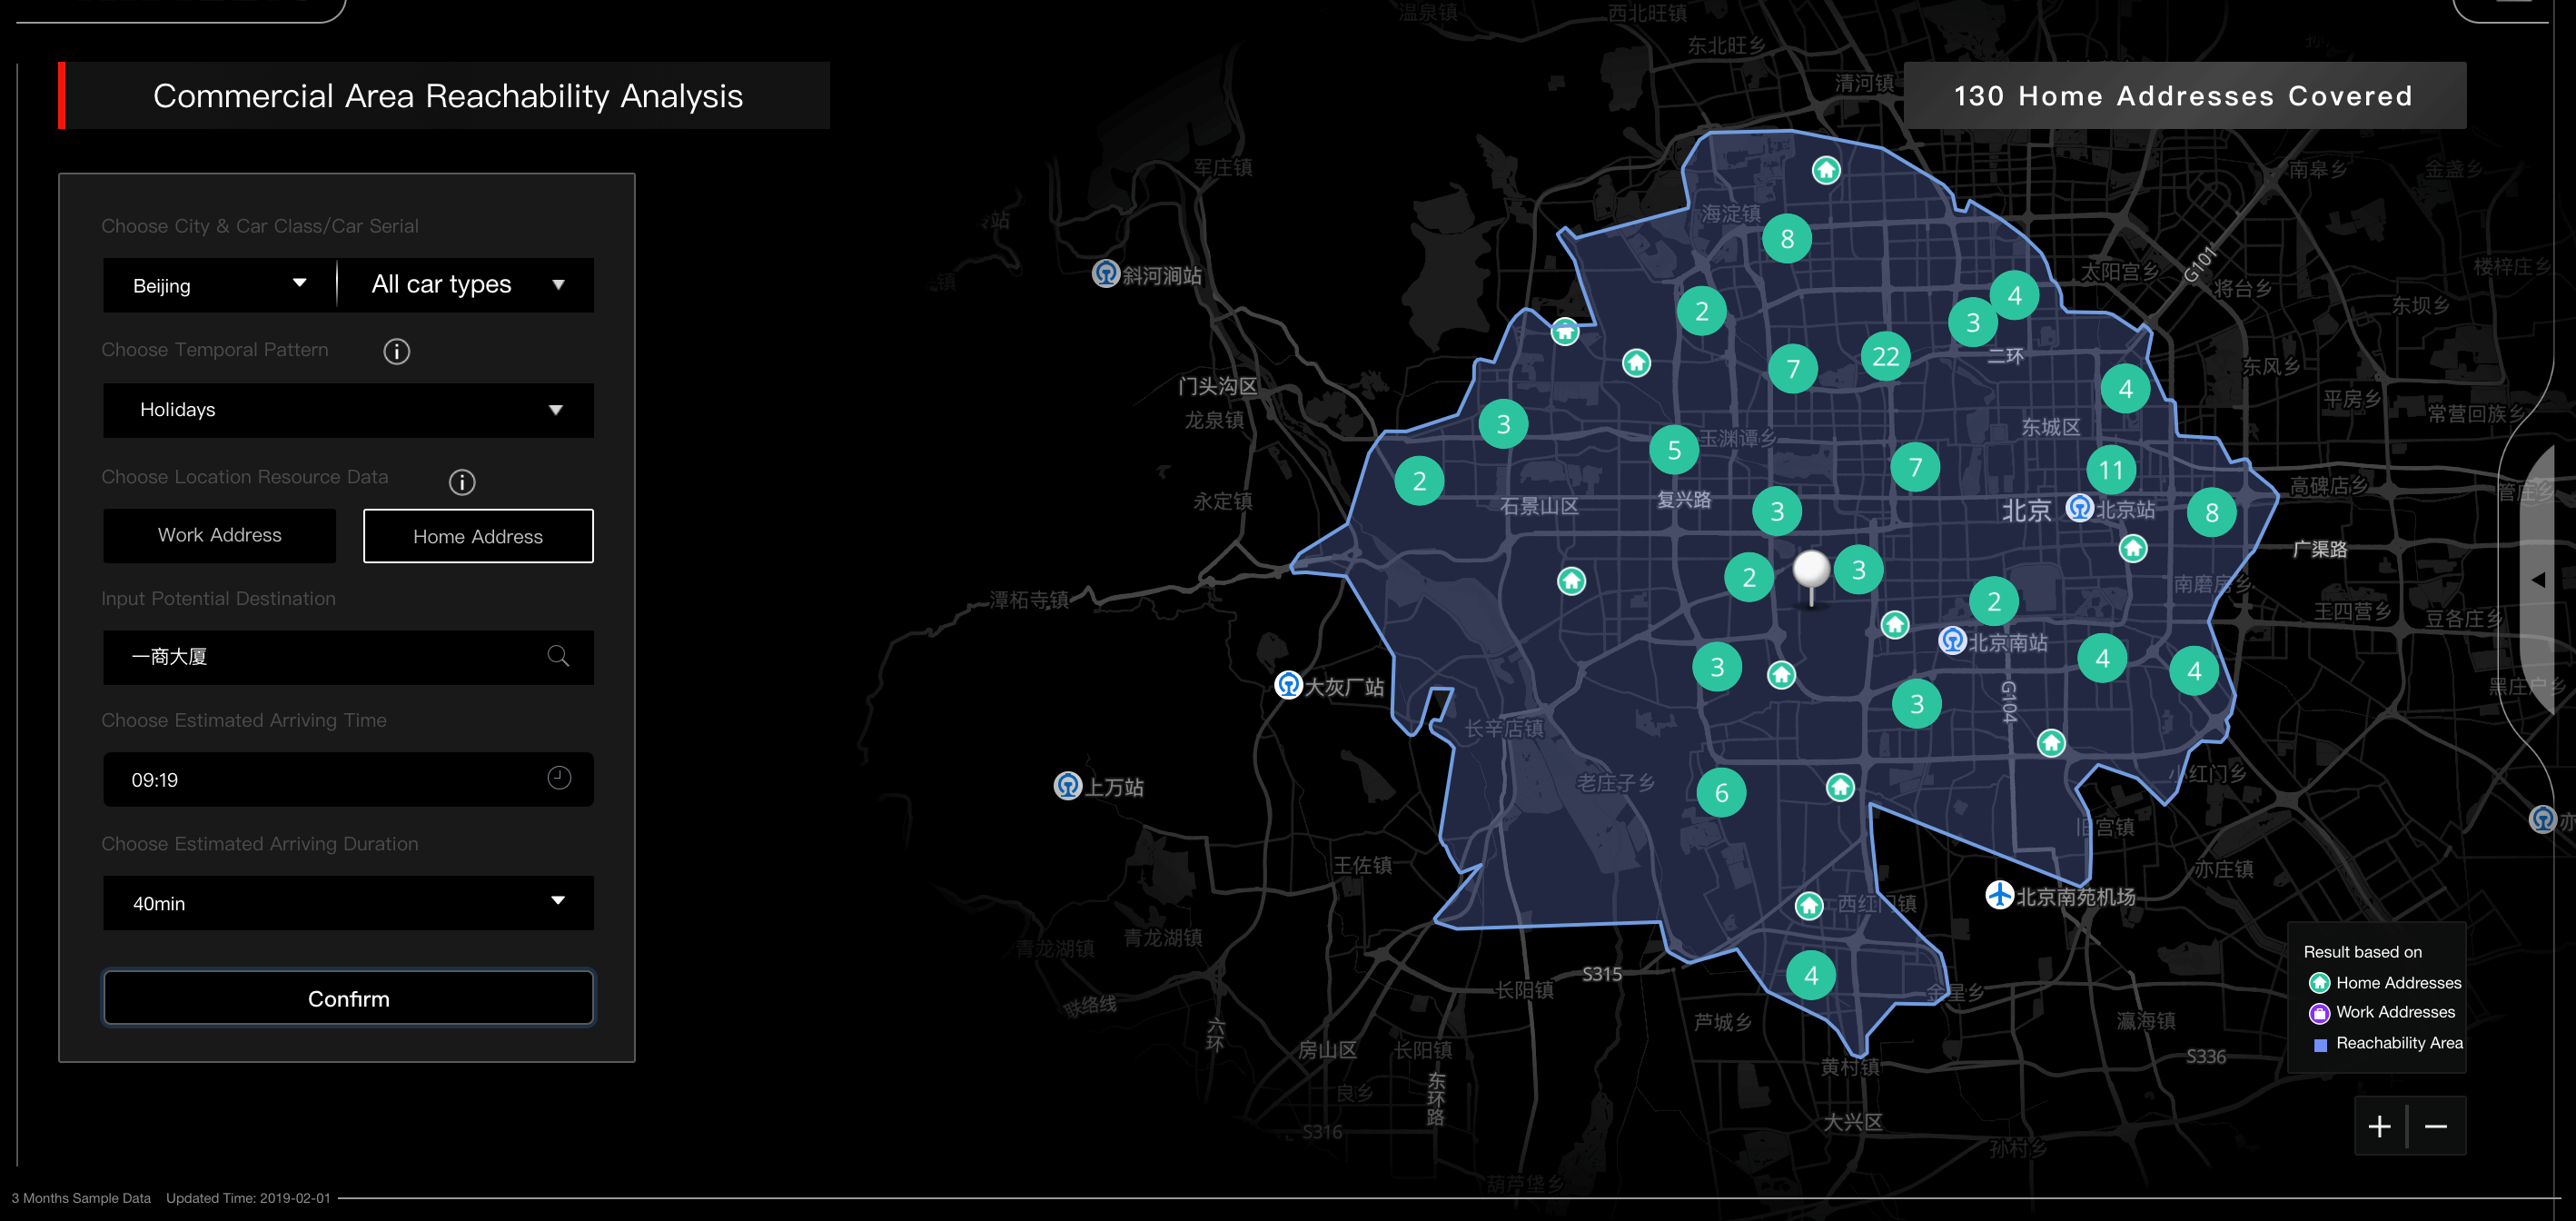
Commerical Area Reachability Analysis based on historical traffic data
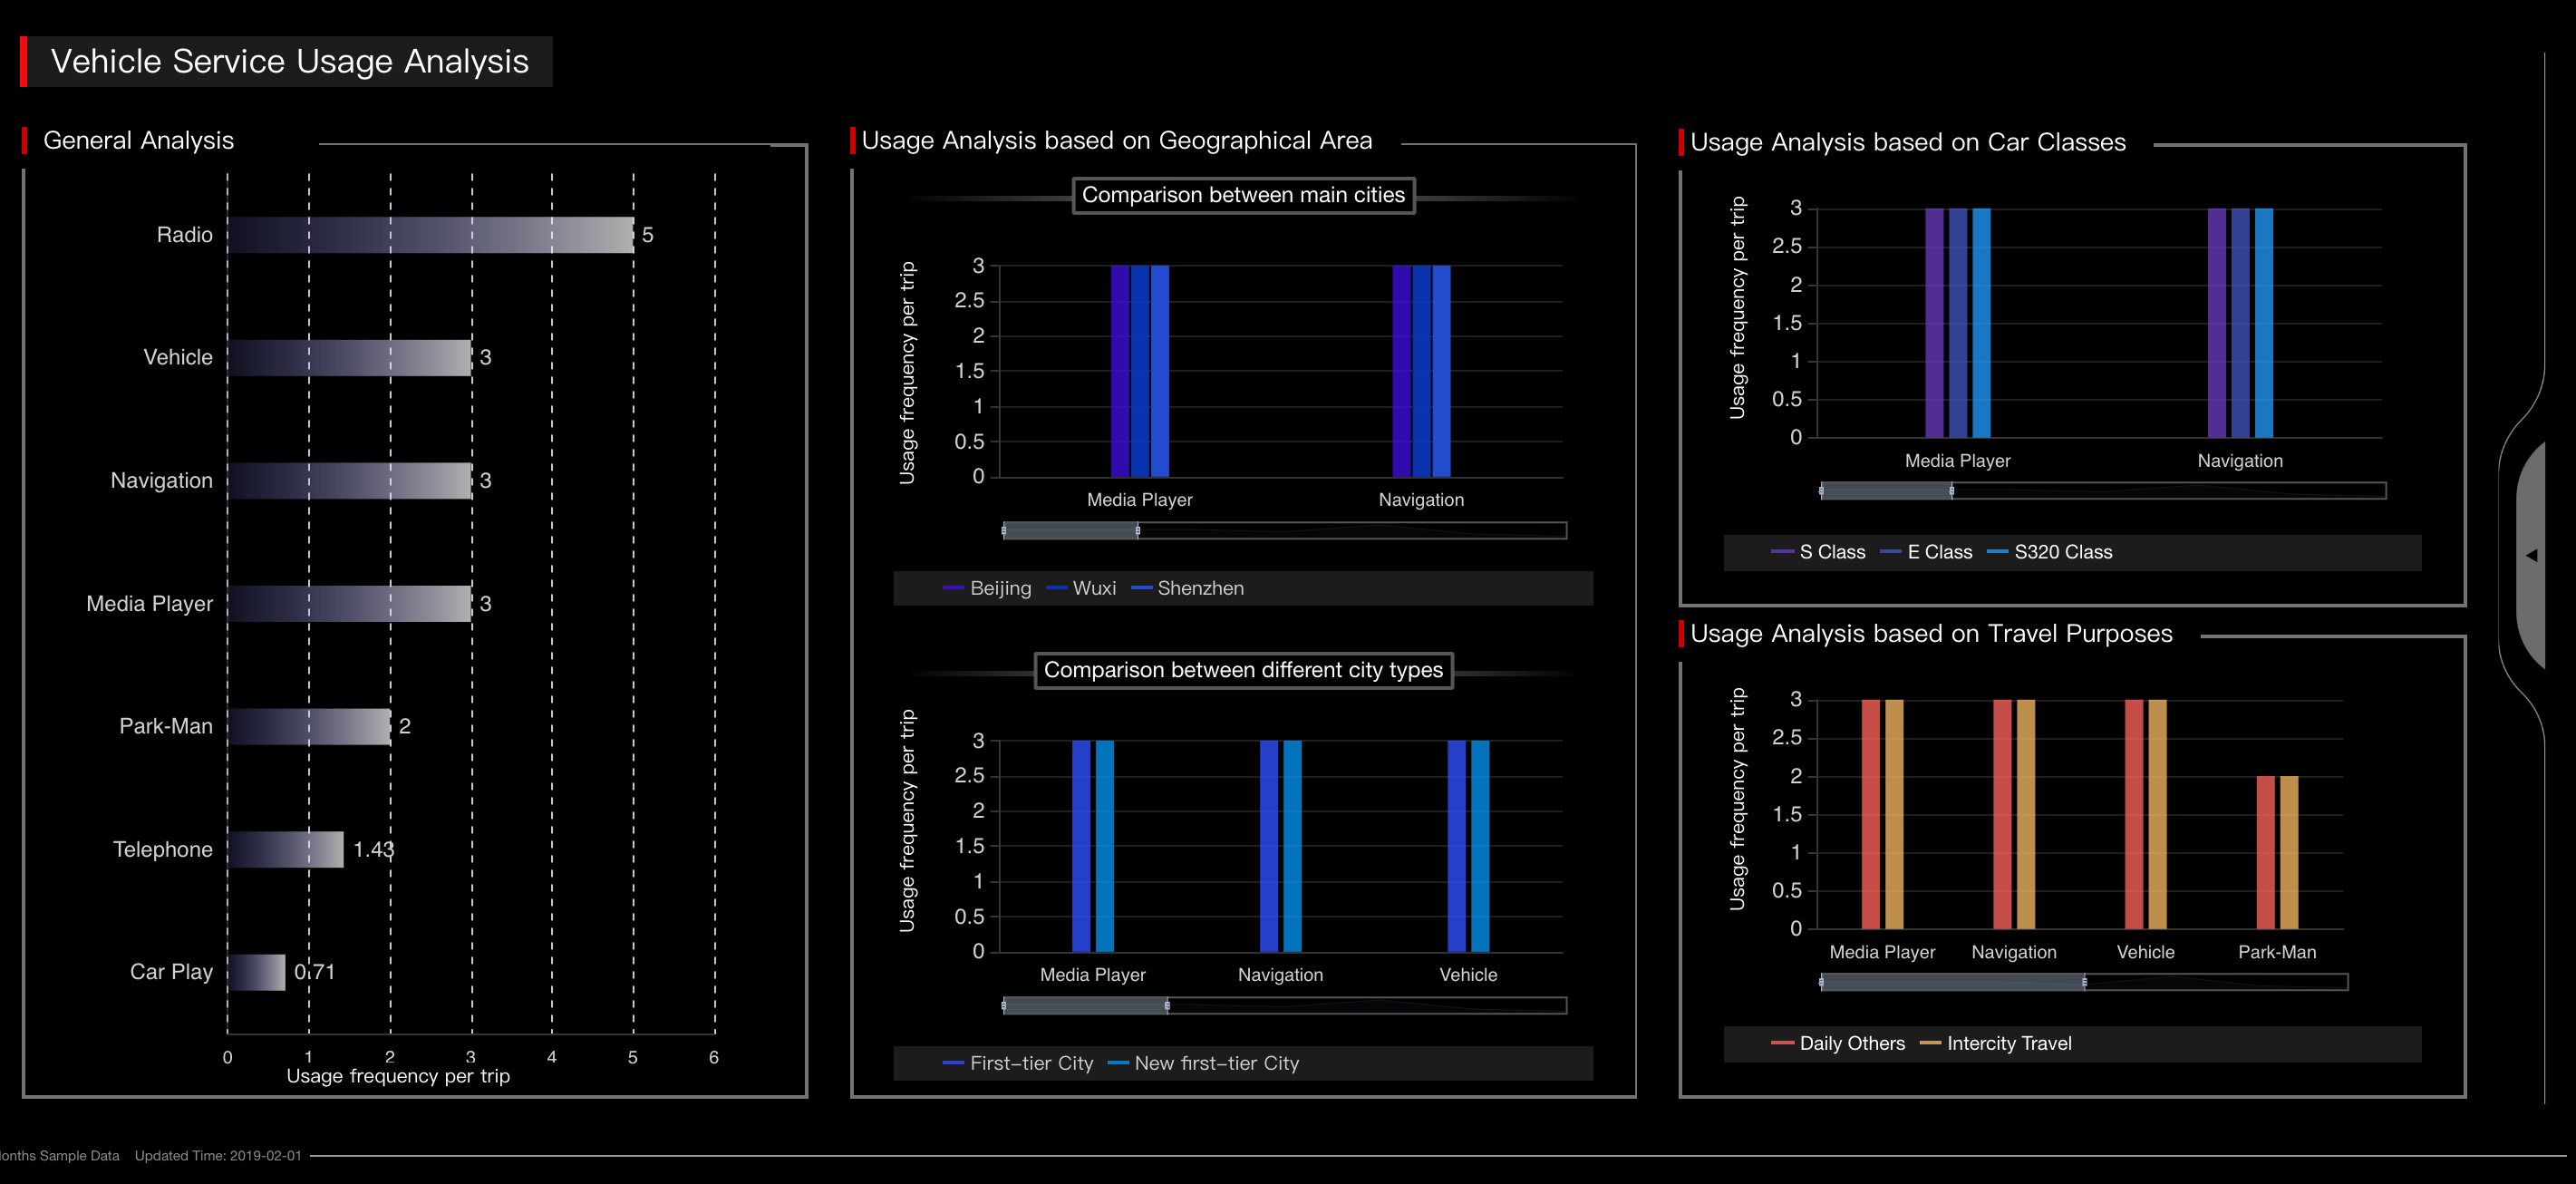
Analyze Car Service Useage under different driving scenarios
Challenge
- 1. The biggest challege of this project is it is innovative, experimental and it involves several algorithms to support use cases.
- 2. This system is required to handle and display expandable data volume,which means the data volume is growing bigger in the furture. When designing the data visualization part, the interaction for growing up data volume is considered.
- 3. This system is also required to be responsive to different screen size including big widen screen (normally, a responsive website doesn't cover big widen screen). In order to achieve this goal, I worked with UI designer to find a smart display and interaction solution.
Design Process
- 1. Understand the available database field types by learning the data sample the client provided.
- 2. Research and brainstorm with engineersto find the potential use cases that can bring values to the clients.
- 3. Understand data analysis methods, data visualization, and algorithm to be applied to these cases.
- 4. Analyze the data required for each case with engineer team.
- 5. Draw wireframe of each cases.
- 6. Present use case proposal to the client to get feedback and did iteration.
- 7. Direct UI Design based on finalized use cases.
Key Takeaways
Since this project is started with a few amounts of sample data, it is hard to cover all situations when real data are coming into the system. When designing the whole system, both PM, designers and engineers need to consider some general conditions in a data-based project, such as data volume getting huger, and data classifications can extend.